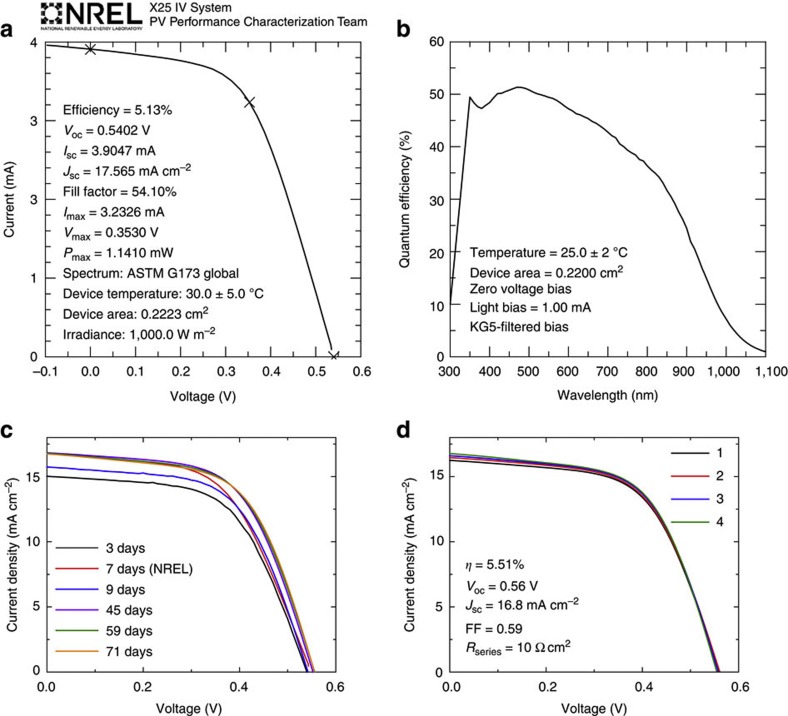
Figure 7. Certified PV performance and stability.
(a) Current density versus voltage characteristics of a QDSSC certified by NREL. (b) EQE spectra for the device measured at NREL. (c) Performance of our champion device (different from the one in a and b) over time, including the certification data from NREL. The device was tested further (for example, day 1, day 4, day 6, and so on), but these measurements are not included in for plot clarity. (d) Sequential measurements of our champion device at 71 days under constant illumination for ~15 min. Each measurement takes 90 s, there was a 1 min delay between J–V measurements. The photovoltaic performance properties related to c and d can be found in Supplementary Tables S8 and S9.

