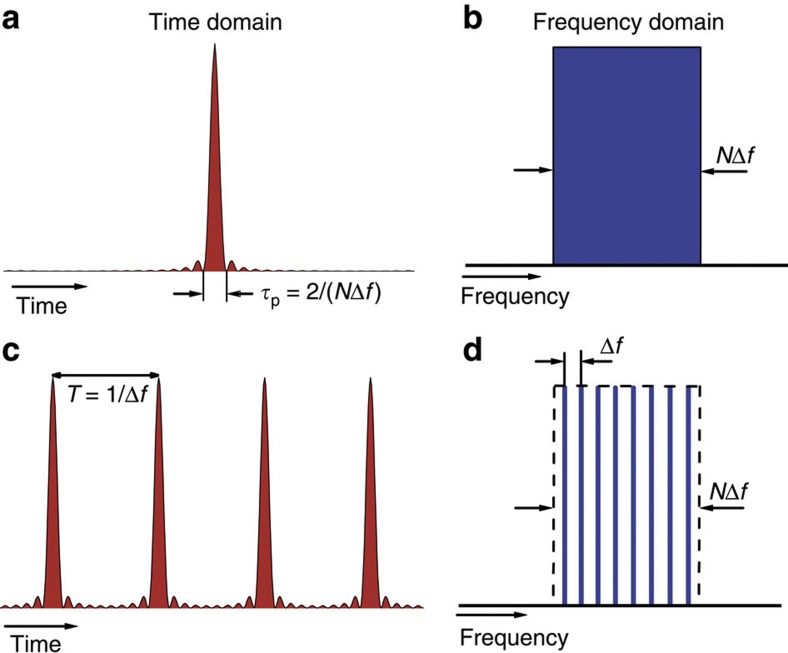
Figure 2. Time–frequency correspondence for sinc-shaped Nyquist pulses.
Time (left) and frequency (right) representation of a single-sinc pulse (top) and a sinc-pulse sequence (bottom). Since the directly observed quantity in the optical domain is proportional to the optical intensity (or power), here the figure shows the intensity of the time-domain traces instead of the field amplitude. The Fourier domain representation of a sinc pulse (a) is a rectangular function (b), while the spectrum of an unlimited sinc-pulse sequence (c) is a frequency comb with uniform phase under a rectangular envelope (d).

