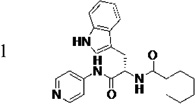
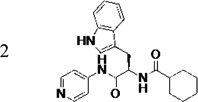
Table 1.
Biochemical and cell-based activities, microsome stability and CYP inhibition properties of LP10 and analogs 1 and 2
| compound | KD (nM) |
EC50 (µM) |
Microsome stability t1/2 (min)a |
% inhibition of human CYPs at 10 µM (unless indicated otherwise) |
||||
|---|---|---|---|---|---|---|---|---|
| h | m | 1A2 | 2C9 | 2D6 | 3A4 | |||
 |
≤42 | 0.65 | - | - | - | - | - | - |
 |
≤5 c | 0.68 | 3.8 | 4.2 | 41 (23)d | 99 (92)d | 93 (77)d | 96 (75)d |
 |
140 | 1.5 | 6.5 | 6.9 | 55 (21)d | 99 (92)d | 96 (62)d | 99 (77)d |
| Sutentb | - | - | 30 | 11 | - | - | - | - |
| Furafylline (40 µM)b | - | - | - | - | 86 | 5 | 4 | 8 |
| Sulfaphenazoleb | - | - | - | - | 20 | 92 | 7 | 21 |
| Quinidineb | - | - | - | - | 23 | 9 | 90 | 36 |
| Ketoconazole (1 µM)b | - | - | - | - | 22 | 22 | 4 | 95 |
Stability of compounds in human (h) and mouse (m) liver microsomes, using sunitinib as a reference control.
Reference compounds for microsome stability and human CYP inhibition
KD of ≤5 nM (a hundredth of the target concentration) was estimated from the titration curves at 0.5 µM TcCYP51 for the tightest binding inhibitors, if a plateau was reached at the stoichiometric enzyme-inhibitor ratio.
Values in parentheses are % inhibition of the indicated human CYPs at 1 µM.
