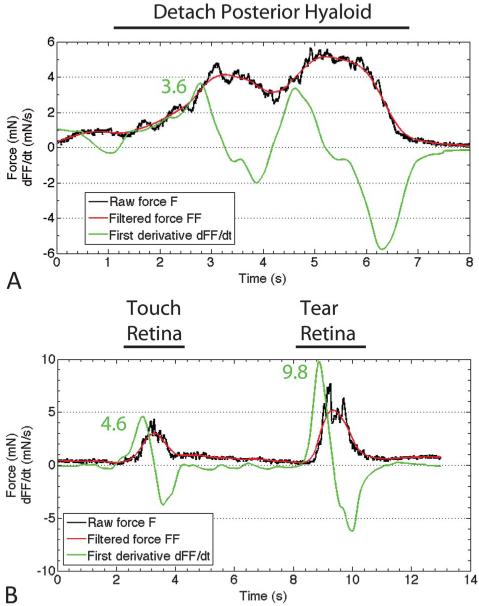
Fig. 4.
A. Representative tracing of the first derivative of the smoothened force during posterior hyaloid detachment. The black tracing is the raw forced data curve, the red tracing is the smoothened force data curve, and the green line is the first derivative of the smoothened force. The peak first derivative force was 3.6. B. Representative tracing of the first derivative of the smoothened force during creation of a retinal tear. The peak first derivative force was 4.6 for touching the retina and 9.8 for causing a retinal tear.

