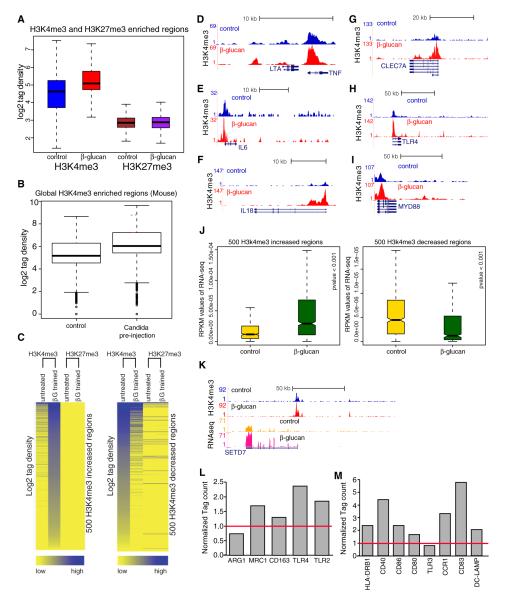
Figure 4. β-Glucan Alters the Epigenetic Landscape in Trained Monocytes, and This Correlates with β-Glucan-Induced Transcriptomal Changes.
(A) Box plot of log2 tag density of H3K4me3 and H3K27me3 signal in control versus trained monocytes.
(B) Box plot of log2 tag density for genome-wide H3K4me3 enriched regions in peritoneal macrophages retrieved from untreated (control, saline) and Candida preinjected mice.
(C) Intensity plots showing the normalized tag density for H3K4me3 and H3K27me3 on the 500 H3K4me3 enhanced and decreased regions.
(D–I) Genome browser screen shot showing H3K4me3 binding over TNF-α (D), IL-6 (E), IL-18 (F), DECTIN-1 (G), TLR4 (H), and MYD88 promoter regions (I) before and after the treatment with β-glucan.
(J) Box plot showing RNA expression (RPKM) of the genes associated with top and bottom 500 regions with H3K4me3 changes.
(K) H3K4me3 tag density as well as RNA-seq expression data over SETD7 histone methyltransferase before and after the treatment with β-glucan.
(L and M) RPKM values of genes after β-glucan treatment of monocytes. The genes are markers of classically and alternatively activated macrophages (L) and of inflammatory Tip-DCs (M). See also Figure S3.

