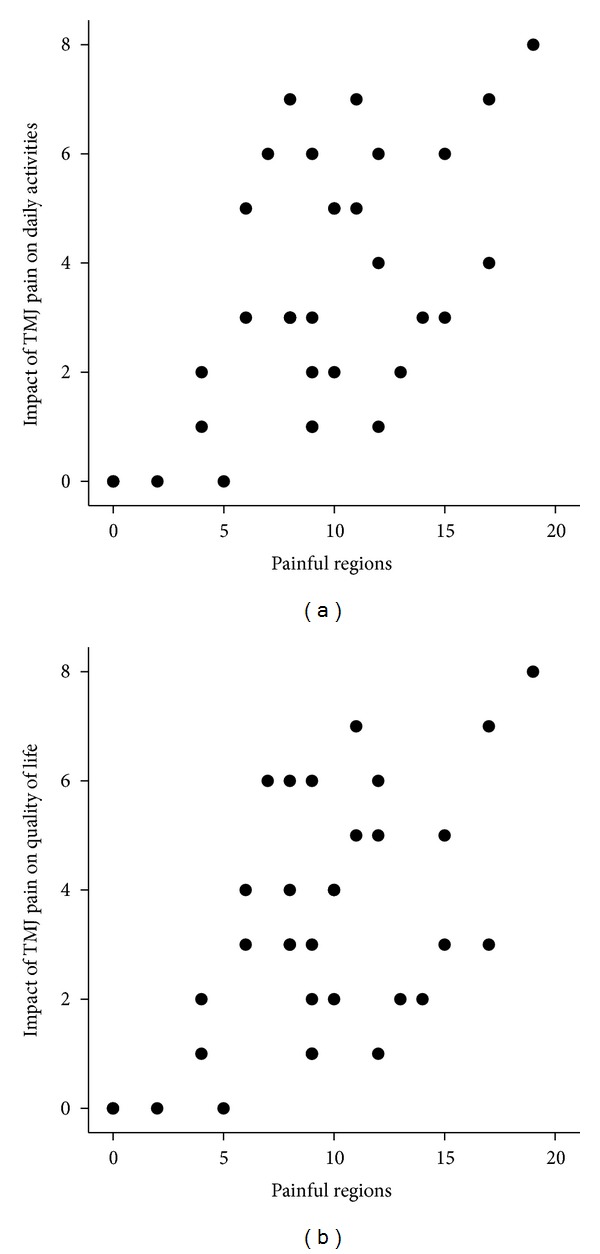
Figure 2.

Scatter plots showing the relation between the number of painful regions and the impact of temporomandibular joint (TMJ) pain on daily activities ((a): r s = 0.53, n = 33, P = 0.002) and quality of life ((b): r s = 0.49, n = 33, P = 0.004).
