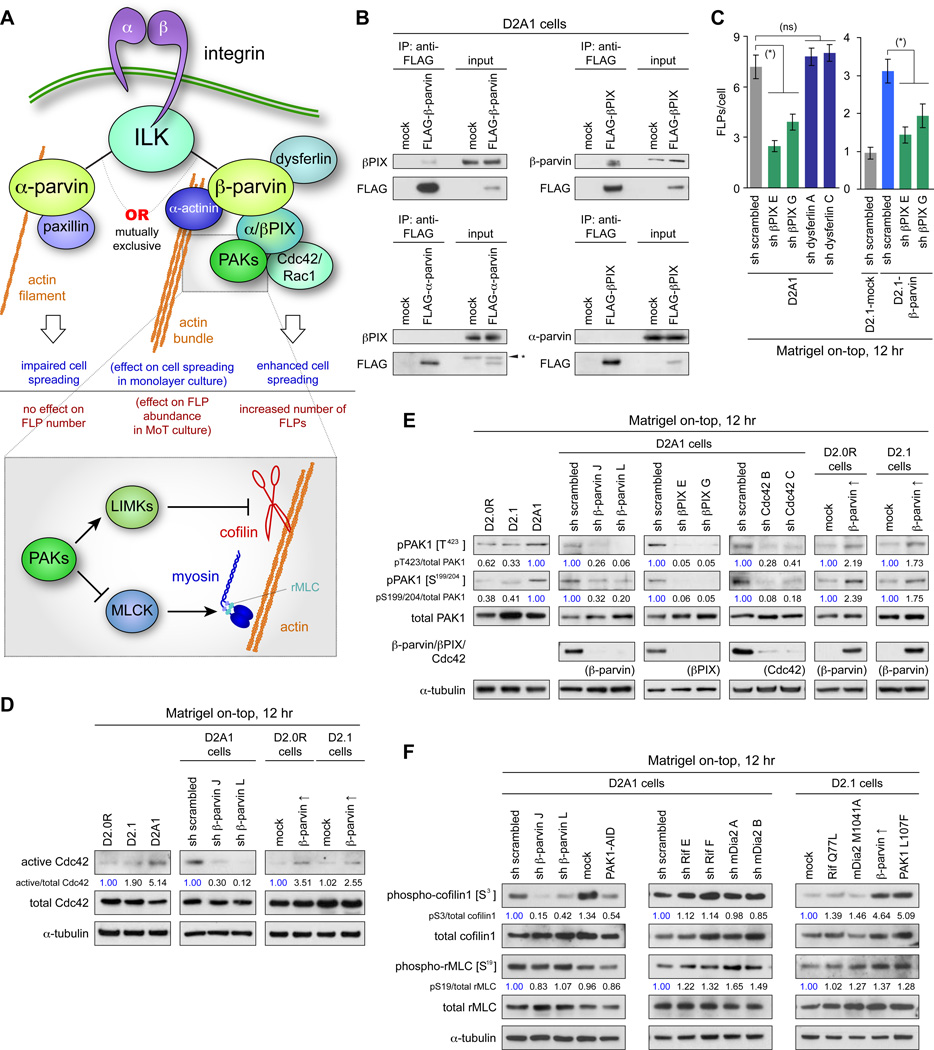
Figure 2. ILK/β-parvin/βPIX/Cdc42/PAK/LIMK/cofilin signaling in FLP formation.
(A) Integrin-actin coupling by ILK/α-parvin and ILK/β-parvin complexes. α-parvin and β-parvin bind to ILK, each providing a link between integrins and actin cytoskeleton, while having different effects on cell behaviors.
(B) β-parvin/βPIX interactions. Lysates from FLAG-β-parvin-, FLAG-α-parvin- or FLAG-βPIX-expressing cells were subjected to anti-FLAG immunoprecipitation and analyzed by immunoblotting. βPIX interacts with β-parvin, but not with α-parvin. (*) nonspecific bands.
(C) Role of βPIX in FLP regulation. Knocking down the expression of βPIX, but not that of dysferlin (a transmembrane protein that interacts with β-parvin; Matsuda et al., 2005) reduced FLP abundance in the D2A1 cells. Values = means ± SEM (n = 100). (*) p < 0.001, (ns) p > 0.3.
(D) β-parvin expression and Cdc42 activation. Values represent the intensities of the active Cdc42 bands relative to that of corresponding total Cdc42 band.
(E) β-parvin/Cdc42/βPIX signaling in PAK phosphorylation. Here and in F, values represent the intensities of pPAK1 (phospho-cofilin1/phospho-rMLC) bands relative to that of the corresponding total PAK1 (cofilin1/rMLC) band. The blots are representative of multiple independent experiments.
(F) Cofilin and rMLC phosphorylation in the downstream of β-parvin/PAK signaling. Bars = 10 µm. See also Figure S2.

