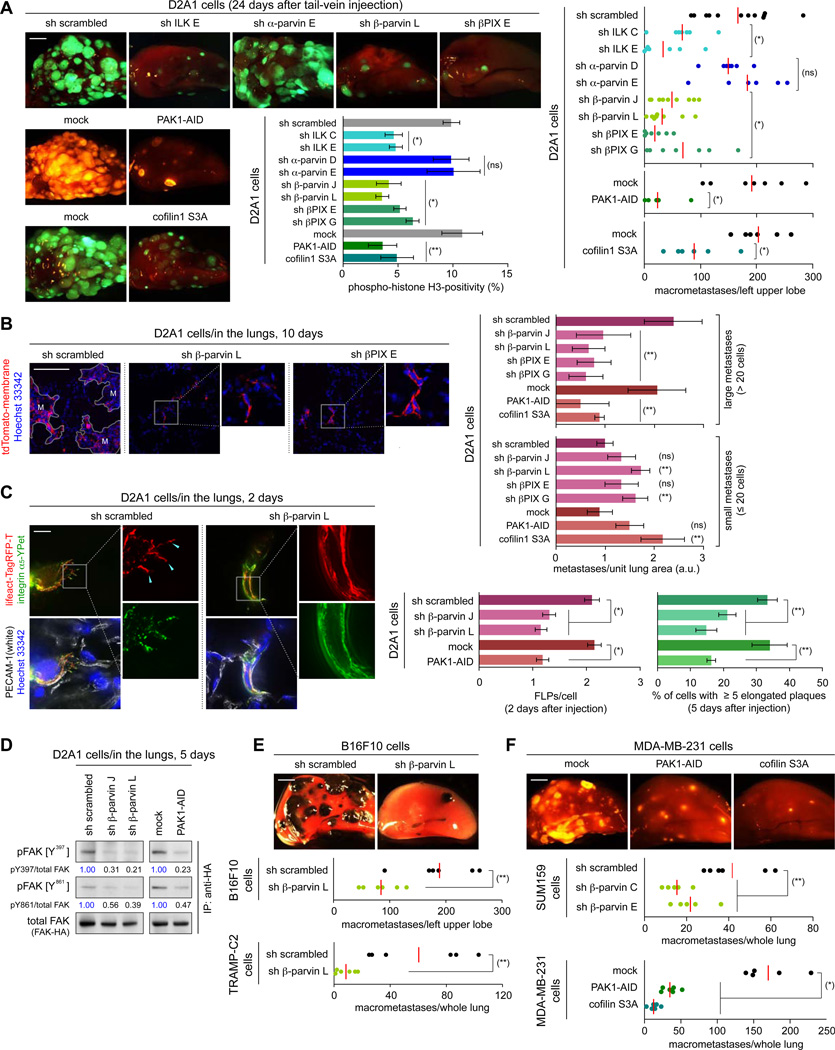
Figure 5. in vivo effects of ILK/β-parvin/cofilin signaling manipulation.
(A, B) ILK/β-parvin/cofilin signaling and metastatic colonization. The D2A1 cells expressing fluorescent markers (GFP or tdTomato; A, tdTomato-membrane; B) were manipulated as indicated and tail-vein injected. In A, representative lung images (left) and the numbers of macrometastases (right) 24 days after injection, as well as the phospho-histone H3 positivity of the cells residing in the lungs 7 days after injection (middle), were presented. Here and in E, F, the red bar represents the mean value within each sample group. In B, relative numbers of small (≤ 20 cells) and large metastases (> 20 cells) were quantified on the lung sections prepared 10 days after injection. M = large metastases.
(C, D) β-parvin/PAK axis and in vivo cell-matrix adhesions. In C, the D2A1 cells expressing integrin α5-YPet (green) and lifeact-Tag-RFP-T (red), further engineered as indicated, were tail-vein injected. FLP formation was analyzed on the lung sections, where blood vessels (PECAM-1; white) and nuclei (Hoechst 33342; blue) were also visualized (left/middle). The formation of elongated adhesion plaques was scored similarly, except for using α-actinin-Tag-RFP-T fusion protein instead of lifeact-Tag-RFP-T (right). In D, the D2A1 cells engineered as indicated, also expressing FAK-HA, were tail-vein injected. 5 days later, FAK-HA was immunoprecipitated from the lung lysate and analyzed by immunoblotting.
(E, F) Role of ILK/β-parvin/cofilin signaling in lung colonization by various cell types. The control and manipulated B16F10, TRAMP-C2, SUM159 and MDA-MB-231 cells, also expressing GFP (E) or tdTomato (F), were tail-vein injected and subsequent formation of lung metastases was analyzed.
Values = means ± SD (n = 3: A [middle], B, C [right]); means ± SEM (n = 150: C [left]). Bars = 2 mm (A, E, F), 100 µm (B), 10 µm (C). (*) p < 0.005, (**) p < 0.05, (ns) p > 0.05 (vs sh scrambled/mock). See also Figure S5.

