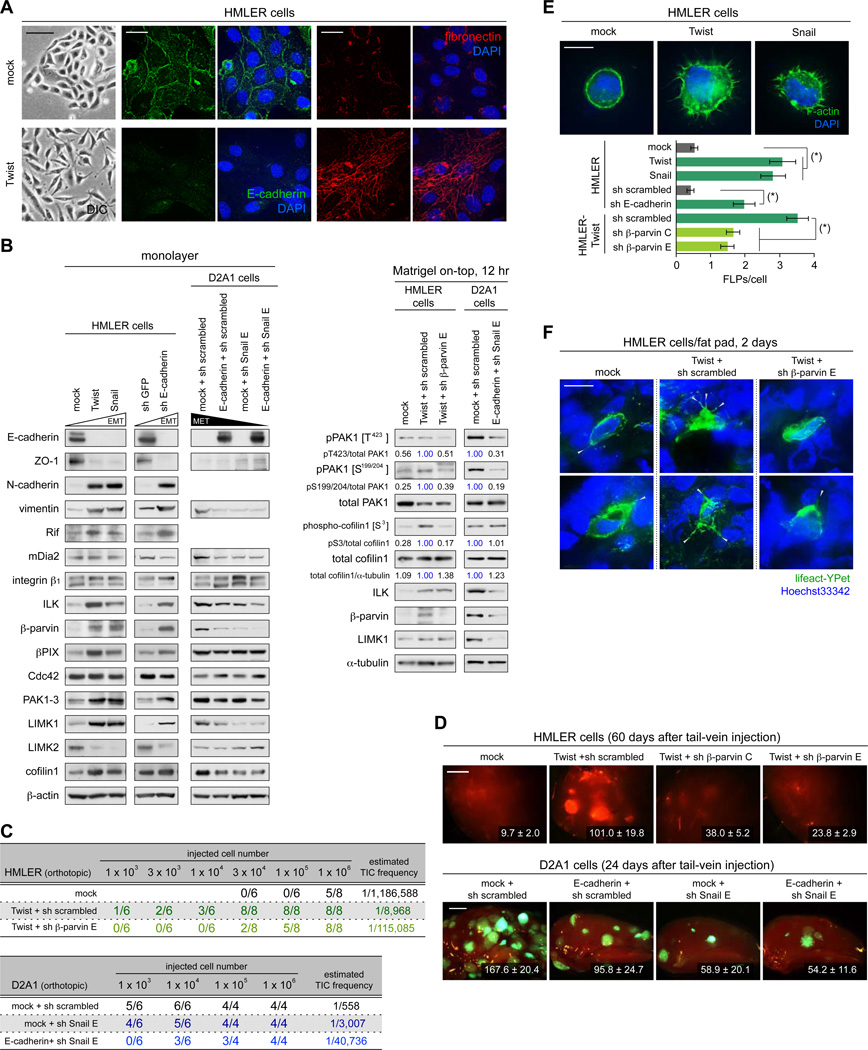
Figure 8. Functional connection between FLP formation and EMT program.
(A) Twist-induced EMT in the HMLER cells. The control (mock) and Twist-expressing HMLER cells were propagated as a monolayer and stained for E-cadherin (green), fibronectin (red) and the nuclei (blue) (right). Differential interference contrast (DIC) images of these cells are also presented (left).
(B) Changes in the expression levels of EMT-markers and FLP-regulators. HMLER cells and D2A1 cells were engineered as indicated to undergo an EMT and MET, respectively. These and the control cells were propagated either as a monolayer (left) or in MoT cultures (right) and analyzed by immunoblotting.
(C, D) Effect of EMT/MET on primary tumor formation and metastatic colonization. In C, indicated cell types were mammary fat pad-implanted and primary tumor formation was scored. In D, indicated cells types, also expressing GFP or tdTomato, were tail-vein injected to score metastasis formation in the lungs. The numbers of macrometastases observed on the surface of the entire lungs (HMLER) or left upper lobe of the lungs (D2A1) are presented.
(E, F) FLP formation before and after EMT induction. In E, the HMLER cells engineered as indicated were analyzed for FLP formation in MoT culture. (*) p < 1 × 10⁻⁵. In F, HMLER cells engineered as indicated were further manipulated to express lifeact-YPet. These and non-labeled cells were mixed and fad pad-implanted to score the formation of FLPs (gray arrowheads).
Values = means ± SEM (n ≥ 5: D, n = 100: E). Bars = 100 µm (A [left]), 20 µm (A [right]), 2 mm (D), 10 µm (E, F). See also Figure S8.

