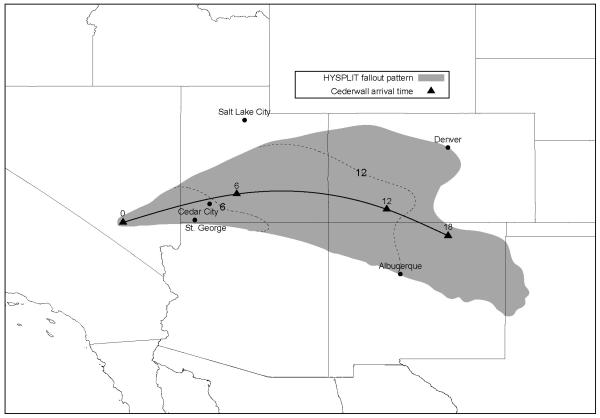
Fig. 3.
HYSPLIT fallout pattern resulting from simulations of the Upshot-Knothole Harry test. The solid black line indicates the estimated centerline of the radioactive cloud as simulated by Cederwall and Peterson (1990). Dashed lines delineate the HYSPLIT-predictions of the geographic boundary of the fallout pattern at the time noted.

