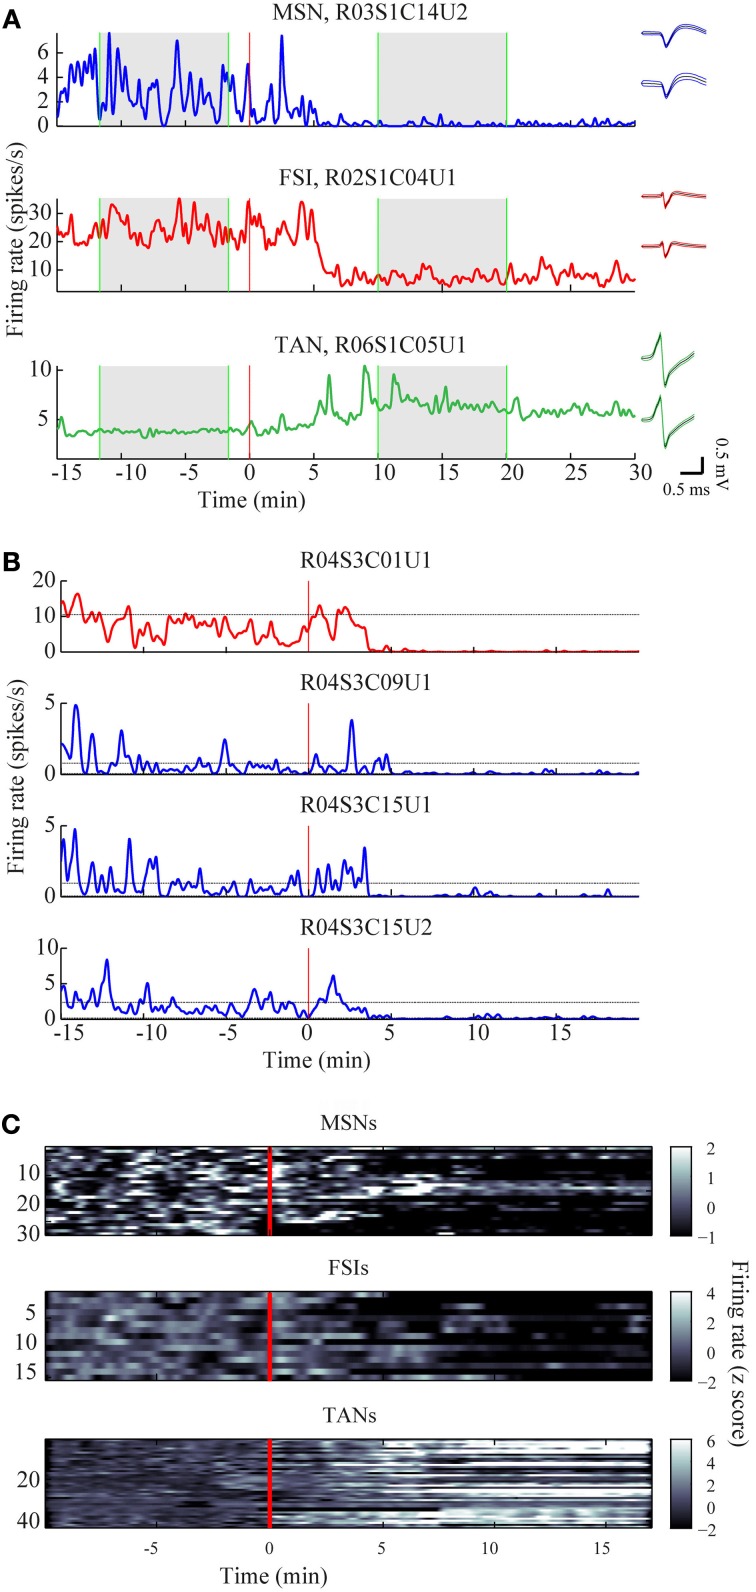
Figure 4.
Time course of firing rate modulations. (A) Examples of firing rate modulations of single MSN, FSI, and TAN. Red vertical lines—haloperidol injection times. Right panel—waveforms of the units before (top) and after (bottom) haloperidol injection (black lines—mean, colored lines mean ± SD). Green vertical lines—time frames used for stable states calculations. (B) Firing rate modulation of the whole neuronal population represented as z scores. (C) Example of haloperidol—induced firing rates modulations of one FSI (top) and three MSNs (bottom) recorded simultaneously.

