
Figure 6.
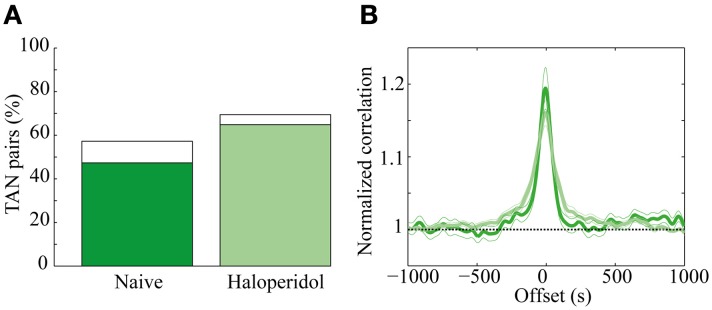
Haloperidol modulation of TAN correlations. (A) Cross-correlation between TAN pairs, divided into significant (p < 0.01) positively correlated (green) and negatively correlated (white). (B) Mean correlation of the TAN pairs in the naïve (dark green) and post-haloperidol (light green). The narrow lines indicate one s.e.m. significance lines and the horizontal black dashed line indicates the normalized unity line. The scale is normalized to the mean rate of each pair.