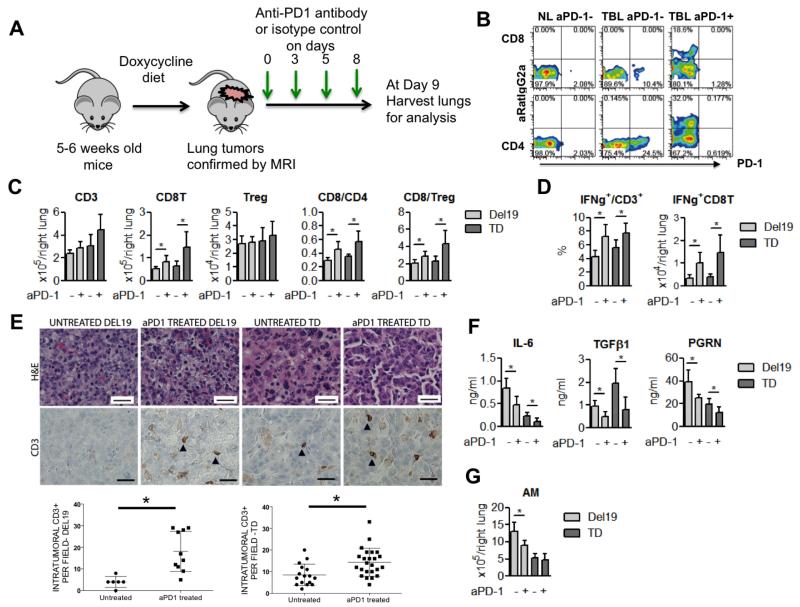
Figure 3. Anti-PD-1 antibody binds to activated T cells and improves effector function.
(a) Schematic of the short term in vivo treatment of mice with anti-PD-1 antibodies after tumor burden was confirmed by MRI imaging. Each group was treated either with isotype control (untreated) or anti-PD-1 antibody on Days 0, 3, 5 and 8 (4 doses), and then at day 9 mice were sacrificed for analysis. (b) Representative flow cytometry results of PD-1+ or RatIgG2a+ (therapeutic anti-PD-1 antibody binding) in CD4+ and CD8+ T cells, anti-PD1 antibody treated mouse (+ aPD1), control antibody treated mouse (- aPD1) (c) Changes in total T cell (CD3), CD8+ T cells, and Tregs, and ratios of CD8/CD4 and CD8/Treg after PD-1 blockade. (d) Enhancement of effector T cell function (IFN-γ production) by PD-1 antibody blockade. (e) CD3 immunohistochemistry (top) and quantification of intra-tumoral CD3+ cells per high power field in untreated and PD-1 antibody treated tumors (bottom). Scale bars indicate 25 μm for all panels. Each point on the graph represents counts from single tumor nodule. For del19, N= 2 for untreated, n=5 for anti-PD-1 antibody treated mice. For TD, n=4 for untreated and n=5 for anti-PD-1 antibody treated mice. P=0.01 for both CD3 graphs. (e) Enhancement of T cell function represented as IFN-γ production by PD-1 antibody blockade. (f) Concentration of the cytokines IL-6, TGF-β1, and PRGN in BALFs. (g) Absolute number of alveolar macrophages in lungs from Del. For all bar graphs in this figure Del 19 (untreated and treated: n=6 and n=7) and TD (untreated and treated: n=6 and n=6) * p<0.05

