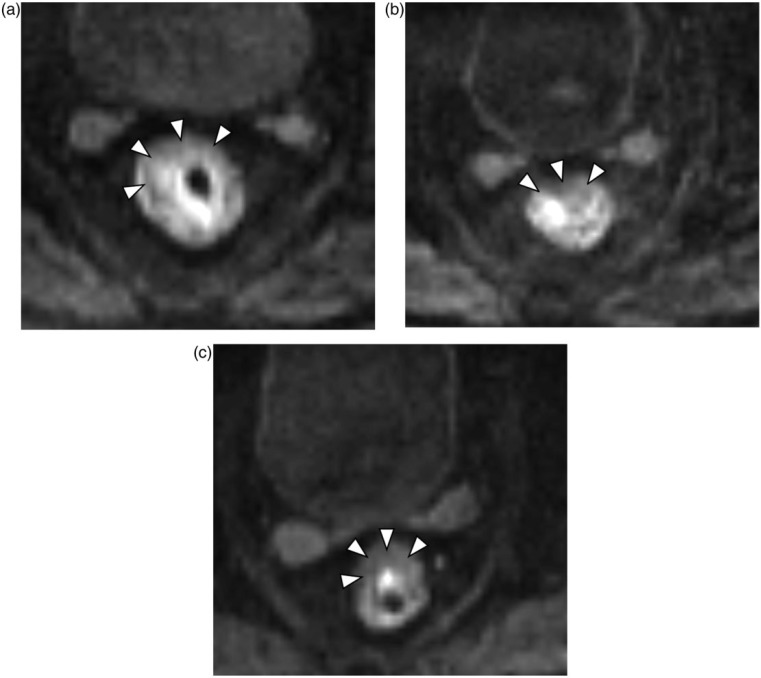
Figure 2.
Axial diffusion-weighted (DW) MR images with b = 800 s/mm2, D values showing a narrow range: (a) pretherapy (D = 0.92 × 10⁻³ mm2/s), (b) at the end of the second week of CRT (D = 1.21 × 10⁻³ mm2/s), and (c) after CRT and before surgery (D = 1.20 × 10⁻³ mm2/s). Arrowheads indicate the tumor outline.

