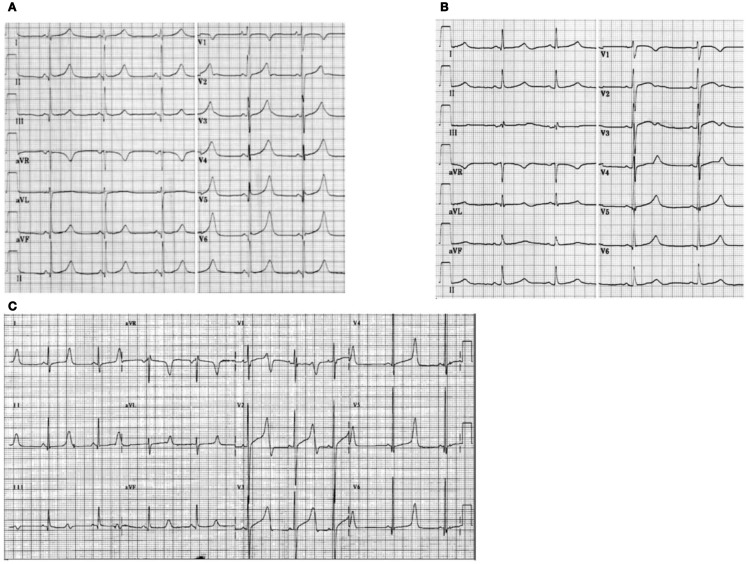
Figure 2.
Electrocardiogram recordings from patients with LQTS1, LQTS2, and LQTS3. (A) 12-lead ECG of an 18-year-old male with a KCNQ1 mutation. The QT interval is prolonged (QTc = ±500 ms). The ST segment has a broad base and relatively large amplitude. Conduction interval is normal (standard calibration). (B) 12-lead ECG of a 14-year-old girl with a KCNH2 mutation. The QT interval is prolonged (QTc ± 520 ms). The ST segment is notched in lead V3 and has relatively low amplitude in the extremity leads. Conduction interval is normal (standard calibration). (C) 12-lead ECG of a 12-year-old boy with a SCN5A mutation. The QT interval is prolonged (QTc ± 600 ms). The ST segment has a long (almost) iso-electric segment with a large, sharp, and narrow T wave. Conduction interval is normal (standard calibration).

