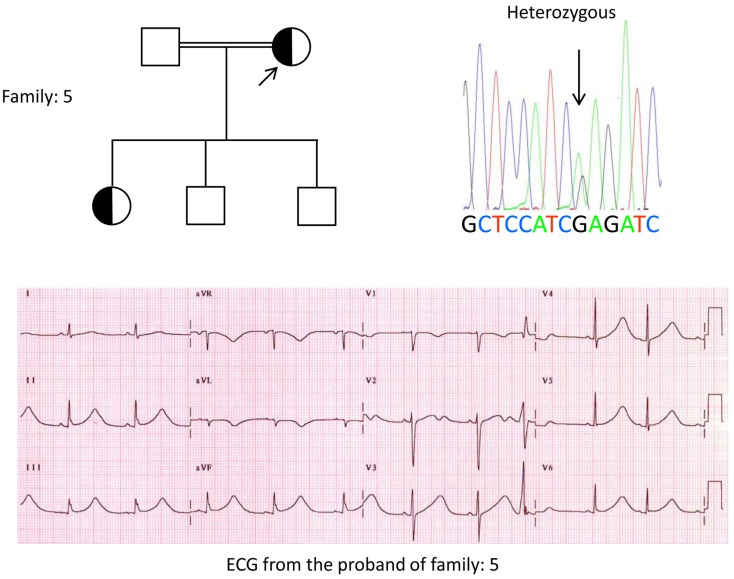
Figure 5.
Top left: pedigree of the family-5. Affected individual is shown by filled circle (female) Proband is indicated by an arrow. 12-lead ECG of the proband (I:2). ECG shows a high peaked, broad based, large amplitude T wave, QTc interval is 580 ms. Screening of the KCNH2 gene shows substitution of nucleotide “G” for an “A” (c.2362G > A, arrow marked), which leads to amino acid substitution, p.E788K.

