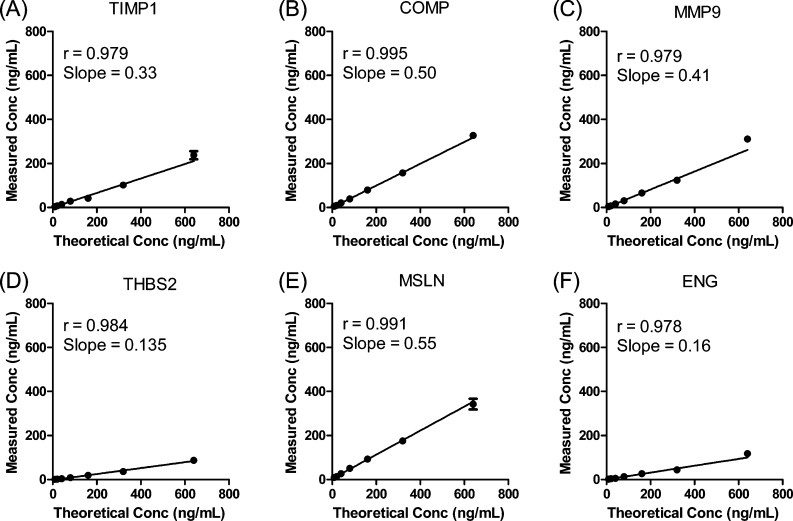
Figure 1.
Response curves for IP-MRM analyses of recombinant TIMP1, COMP, MMP9, THBS2, MSLN and ENG proteins. Proteins were spiked at 10–640 ng/mL in a background matrix of 60 mg/mL BSA in DPBS and analyzed by IP-MRM as described in Experimental Procedures. Values plotted are mean ± standard deviation (n = 3).

