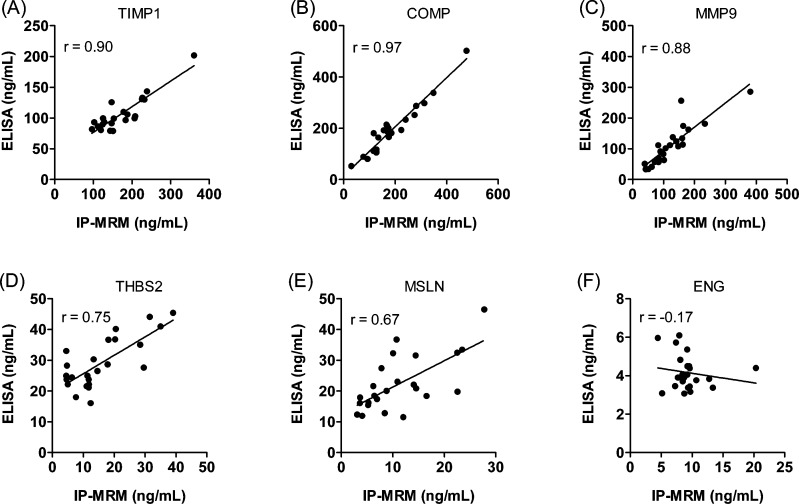
Figure 3.
Correlation of protein expression levels measured by ELISA and IP-MRM in plasma samples. Mean concentrations from triplicate analyses of TIMP1, COMP, MMP9, THBS2, MSLN and ENG in plasma samples from 24 subjects (23 for TIMP1 and MMP9) by ELISA and IP-MRM are plotted. Pearson correlation coefficients are indicated in the figure.

