Fig. 2.
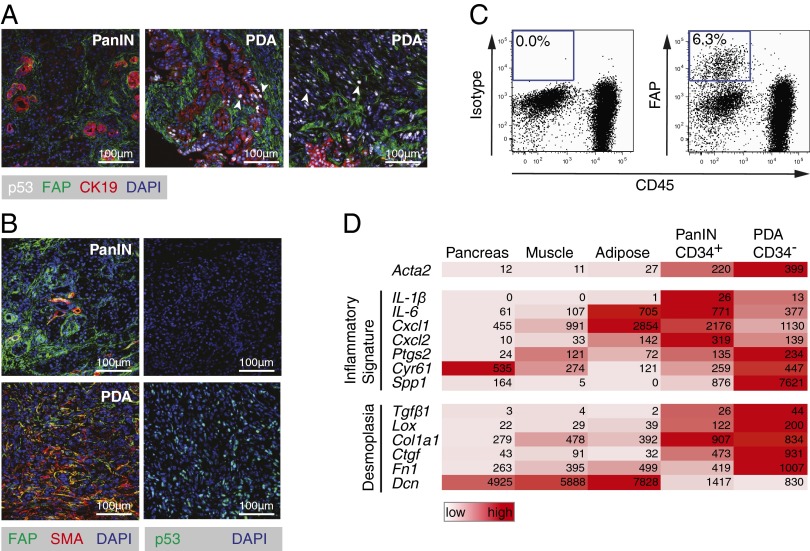
Characterization of FAP+ stromal cells in murine PDA. (A) Tissue sections from PDA tumors were stained for FAP, CK19, and p53 and then analyzed by immunofluorescent (IF) microscopy. White arrows indicate examples of p53+ LOH cells. (B) Tissue sections from PDA tumors were stained for αSMA and FAP and analyzed by IF microscopy. (C) Single-cell suspensions of PDA tumor cells were analyzed by flow cytometry. (D) Heat map presents the reads per kilobase of transcript per million mapped reads of RNA-seq analyses of FACS-purified FAP+ cells.

