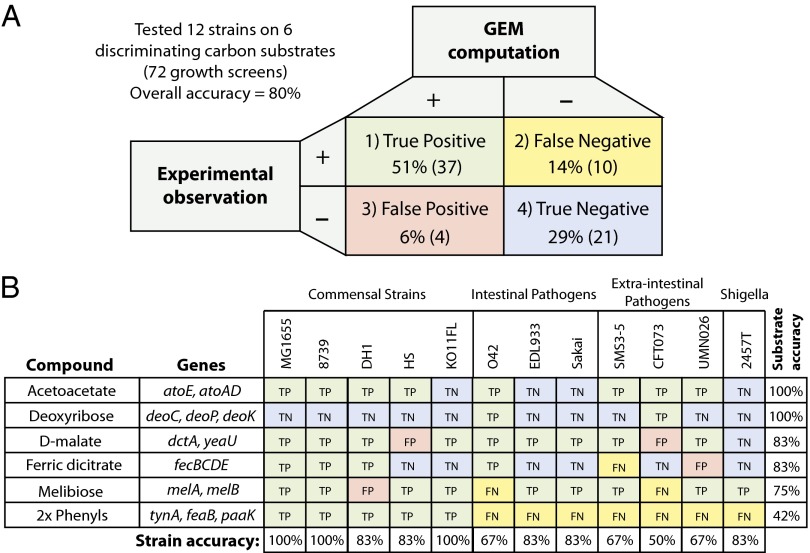
Fig. 5.
Comparison of GEM predictions to experimental results. Comparison of GEM predictions to experimental results revealed a high level of accuracy (80%) both for true positives (quadrant 1) and true negatives (quadrant 4). False negative cases (quadrant 2) represent missing knowledge and are an opportunity for biological discovery. False positive cases (quadrant 3) represent missing context-specific information such as transcriptional regulation. (B) A detailed breakdown of the comparisons based on the pathways (rows) and screened strains (columns).

