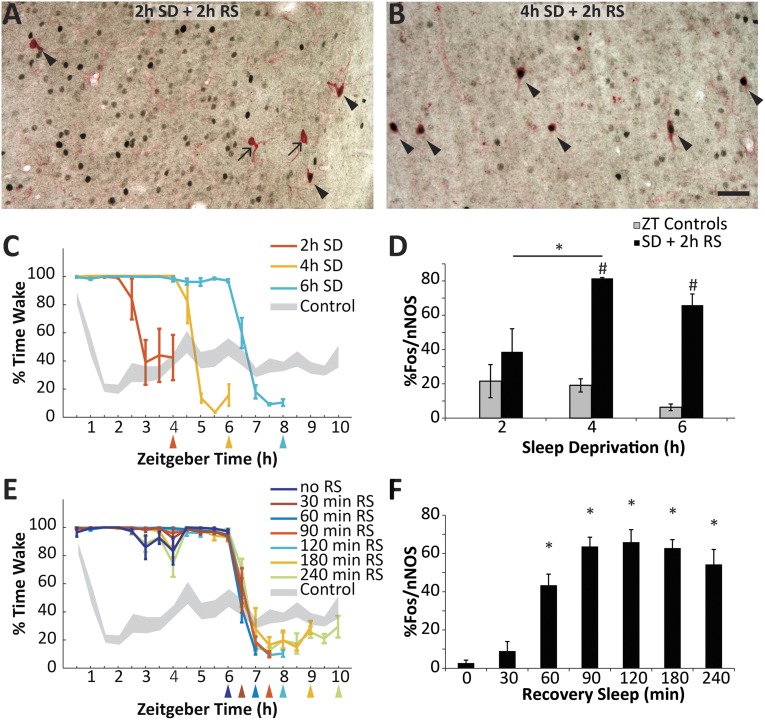
Fig. 1.
The proportion of cortical nNOS neurons expressing Fos is dependent on homeostatic sleep drive and recovery sleep duration. (A) Representative results from the cortex of a rat after 2 h SD plus 2 h RS. Arrows indicate single-labeled nNOS neurons; arrowheads indicate double-labeled Fos+/nNOS cells. (B) Representative results from the cortex of a rat after 4 h SD plus 2 h RS. (C) The percent time awake in rats sleep deprived beginning at ZT0 for either 2 h, 4 h, or 6 h followed by a 2 h RS opportunity (protocol 2). Colored lines denote the experimental groups; gray shading is the pooled control (non-SD) rats (±SEM from mean). Colored triangles below the x axis indicate the time of killing for each group. Because control rats were also killed at the times indicated by the triangles in C and E, the number of rats in the pooled control group decreases from 25 at ZT4 to 8 at ZT10. (D) Proportion of double-labeled nNOS neurons in the three experimental groups depicted in C (black); gray bars are the control values at ZT4, ZT6, and ZT8 replotted from Fig. S1. *P < 0.05 for Holm-Sidak post hoc test after ANOVA; #P < 0.05 for t test against time-matched control group. (E) Percent time awake in rats after 6 h SD followed by RS opportunities ranging from 0 to 240 min. Gray shading represents the pooled control as in C. The 6 h SD + 2 h RS group is also plotted in C. (F) Proportion of double-labeled cortical nNOS neurons in the seven groups depicted in E. *P < 0.05 for Holm-Sidak post hoc test against RS = 0 min after ANOVA. (Scale bar, 50 µm.)

