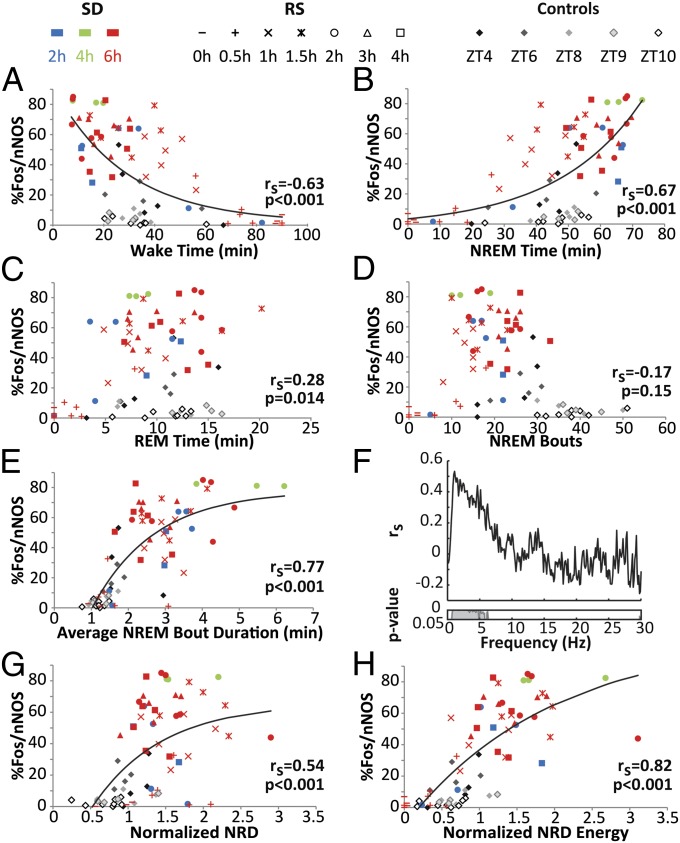
Fig. 2.
The proportion of cortical nNOS neurons expressing Fos is related to NREM and most strongly correlated with NREM δ energy. (A–E) Correlations between the %Fos/nNOS and (A) wakefulness, (B) NREM, (C) REM, (D) number of NREM bouts, and (E) average NREM bout duration during the 90 min before killing for the 75 rats across the 15 groups. Spearman’s correlation coefficients and corresponding P values are at bottom right in each panel. (F) Spearman’s correlation coefficients calculated between the %Fos/nNOS and 0.122-Hz frequency bins of the EEG power spectra during NREM sleep are plotted from 0 to 30 Hz. For each rat, the NREM power spectrum during the 90 min before killing was normalized by division by the NREM power spectrum during baseline (ZT5–7). Inset below shows P values for each 0.122-Hz bin. (G) Correlation between %Fos/nNOS and normalized NREM δ power. (H) Correlation between %Fos/nNOS and normalized NREM δ energy. Exponential growth or exponential growth to maximum functions were fitted for correlations where rs > 0.3.

