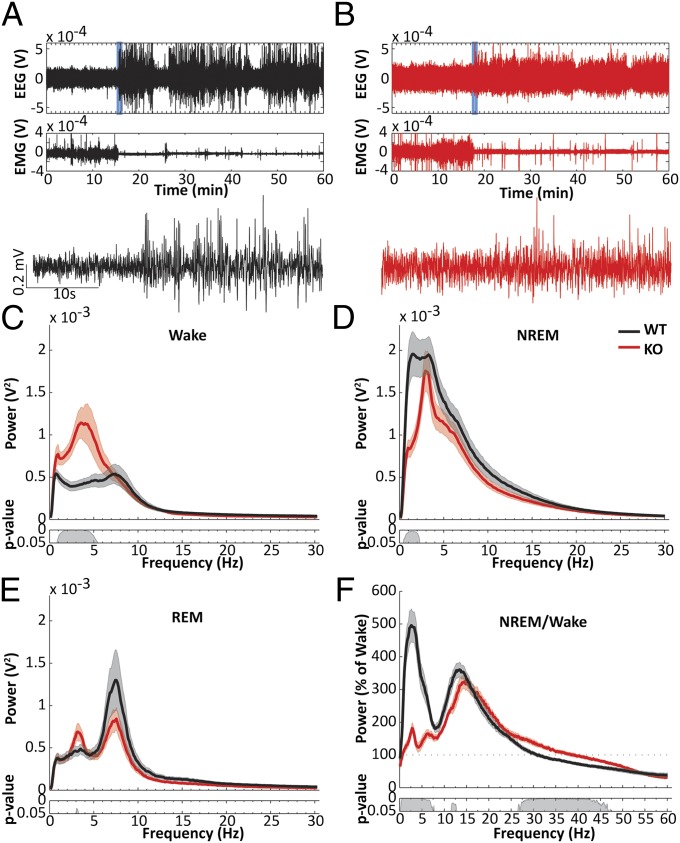
Fig. 3.
EEG activity is abnormal during both waking and sleep in nNOS KO mice. (A and B) Example EEG and EMG recordings from a WT (A; black) and an nNOS KO mouse (B; red). (Lower) EEG during a transition from wakefulness to NREM in the periods depicted by the blue boxes in the EEG trace above. (C) Mean wake EEG spectrum across a 24-h period from WT (black) and nNOS KO mice (red). (Inset) P values for post hoc t tests between the two genotypes after permutation ANOVA. (D) Mean NREM EEG spectra. (E) Mean REM EEG spectra. (F) NREM spectra expressed as percent of wake spectra. Note that the increase during NREM in the low (<5 Hz) frequencies is strongly attenuated in nNOS KO mice, whereas the increase during NREM from 7.5 Hz to 25 Hz is comparable between the two strains.

