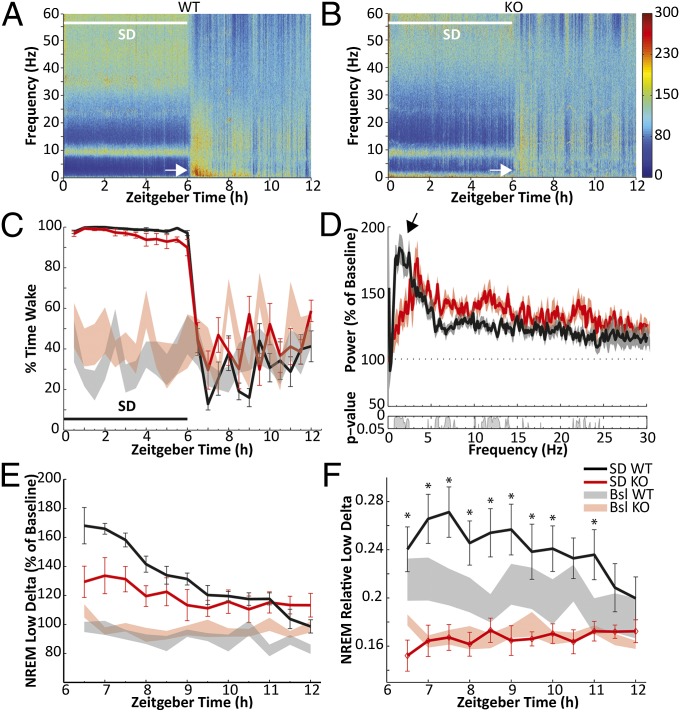
Fig. 5.
The homeostatic response to sleep loss is diminished in nNOS KO mice. (A) Heat map presenting average normalized EEG spectra from 12 WT mice during 6 h SD (white bar) and subsequent 6 h RS. White arrow indicates intense δ activity during the first hours of RS. (B) Heat map from eight nNOS KO mice plotted as in A. White arrow indicates diminished response in the δ range during RS. (C) Wakefulness during SD (black bar) and RS corresponding to A and B for WT (black) and KO (red). Shaded areas indicate wakefulness during the baseline day. (D) NREM spectral power during the first 90 min of RS (ZT6–7.5) relative to NREM spectra during the same time period of the baseline day in WT and KO mice. Arrow highlights greater increase in the low δ (0.5–2.5 Hz) range in WT. No differences were found above 30 Hz. (Inset) P values for post hoc t tests between the two genotypes after permutation ANOVA. (E) Spectral power in the low δ (0.5–2.5 Hz) range during RS relative to the average baseline value in WT and KO. The increase is blunted in KO mice. Shaded areas indicate NREM low δ power on the baseline day. (F) Spectral power in the low δ range (0.5–2.5 Hz) as the proportion of the entire NREM spectra during RS in WT and KO. Shaded areas indicate the relative NREM δ power on the baseline day. In KO mice, there is essentially no response to SD. *P < 0.05 within-subject Holm-Sidak post hoc test against baseline after two-way repeated-measures ANOVA with factors “SD condition” and “time bin.”

