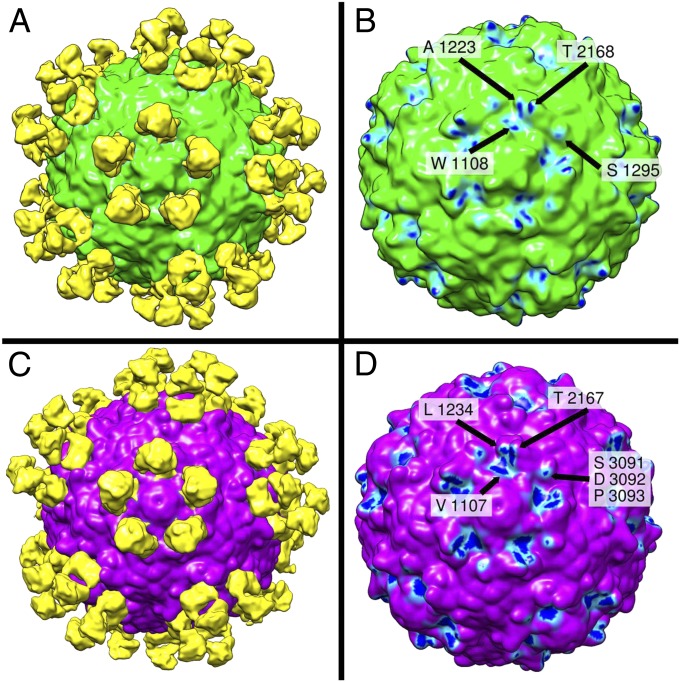
Fig. 1.
Surface rendering of the reconstruction of the A12 Fab-decorated capsid of serotype 1 (A) and serotype 2 (C) of poliovirus based on cryo-EM images. Serotype 1 and 2 of poliovirus are colored in green and magenta, respectively. The Fab-related densities around a fivefold axis are shaded yellow. Antibody footprints (B and D) consist of virion regions representing high-density antibody-bound difference map (close interaction with Fab) shown in dark blue, regions representing intermediate density (weaker interaction) shown in light blue, and the low-density regions (no interaction) are shown in green and magenta for types 1 and 2, respectively. They are W1108, A1223, S1295, and T2168 in serotype 1 (B) and V1107, L1234, and T2167 and in serotype 2 (D). In addition, there was another contact between Fab and the outer rim of the canyon of type 2 poliovirus that could not be unambiguously assigned at this resolution and may be formed by any of the three amino acids S3091, D3092, or P3093.

