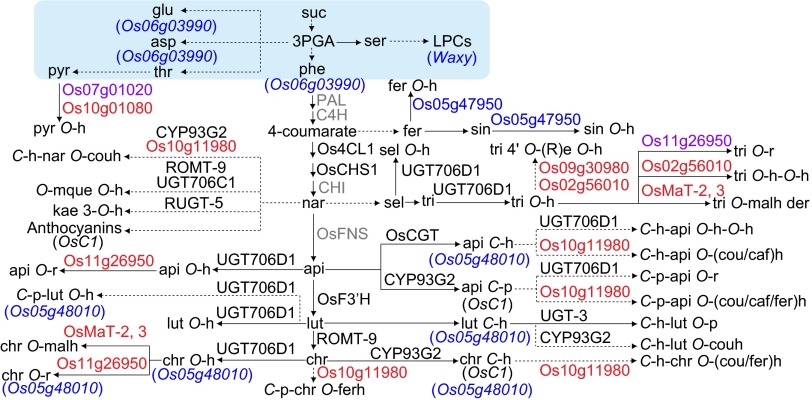
Fig. 5.
Reconstructed rice metabolic pathways based on the metabolomics and metabolic quantitative trait locus (mQTL) analysis. The candidate genes in red and blue indicate the newly mapped genes in flag leaf and germinating seed, respectively. The candidate genes in purple indicate the mapped genes in both tissues. Reported genes shown in black were mapped in this study, whereas those in gray were not. The box in light blue indicates primary metabolic pathways. The full names of metabolites’ abbreviation are given in SI Materials and Methods.

