Fig. 5.
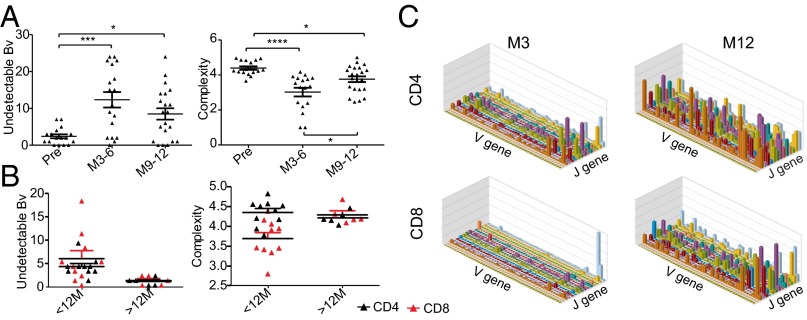
T-cell clonality is reduced after alemtuzumab. (A) CDR3 spectratyping of 22 RRMS patients pre- and postalemtuzumab; mean numbers of undetectable BV families and mean complexity scores for detectable families are shown ± SEM. (B) CD4 and CD8 cells from 10 patients <12 mo of treatment and 5 patients >2 y postalemtuzumab. (C) TCR sequencing of CD4 and CD8 cells from one patient 3 mo after alemtuzumab and a second patient 12 mo posttreatment. V-J histograms are shown. *P < 0.05; **P < 0.01; ***P < 0.001; ****P < 0.0001.

