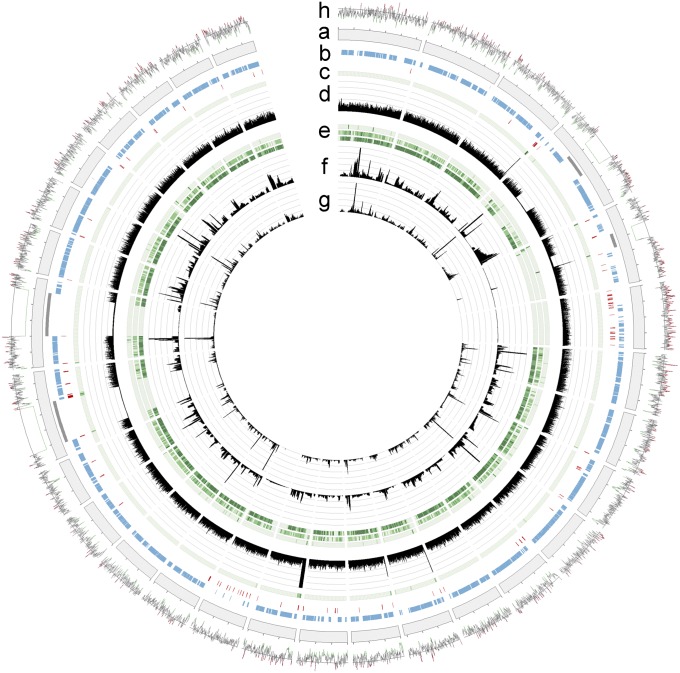
Fig. 2.
Circos circular visualization of the genome assembly. (A) The 30 largest scaffolds of the genome assembly. (B) Locations of gene models (blue), repeated elements (red) and sequence gaps (gray). (C) Genomic SNP density. (D) Read coverage on genome (scale, 0–100). (E) Expressed gene SNP density (outer to inner: RNA-Seq tags from DAOM-197198 spores, R. irregularis C2 spores, and R. diaphanum spores). (F) Transcript coverage, RNA-Seq reads from spores (scale, 0–10,000). (G) Transcript coverage, RNA-Seq reads from symbiotic roots (scale, 0–200). (H) Guanosine and cytosine (GC) content based on a sliding window of 100 bp (red, >40%; green, <20%; midline, 33%).

