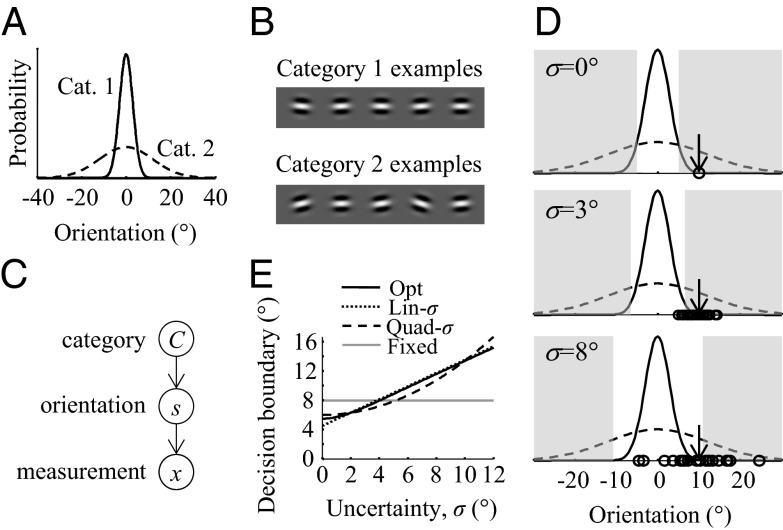
Fig. 1.
Task and models. (A) Probability distributions over orientation for Categories 1 and 2. The distributions have the same mean (0°) but different SDs (σ1 = 3° and σ2 = 12°; for Monkey L, σ2 = 15°). (B) Sample stimuli drawn from each category. (C) Generative model of the task (see text). (D) A completely certain (σ = 0°) optimal observer would set the decision boundaries ±k at the intersection points of the two category distributions (black curves). The shaded areas indicate where the optimal observer would respond Category 2. When sensory noise is larger, not only will the measurements (open circles) be more variable for a given true orientation (arrow), but the optimal observer will also move the decision boundaries to larger values. In the experiment, noise levels are interleaved. (E) Decision boundary as a function of uncertainty level under four models: optimal, linear (example with k0 = 4.5° and σp = 5°), quadratic (example with k0 = 6° and σp = 9°), and Fixed (example with k0 = 8°).

