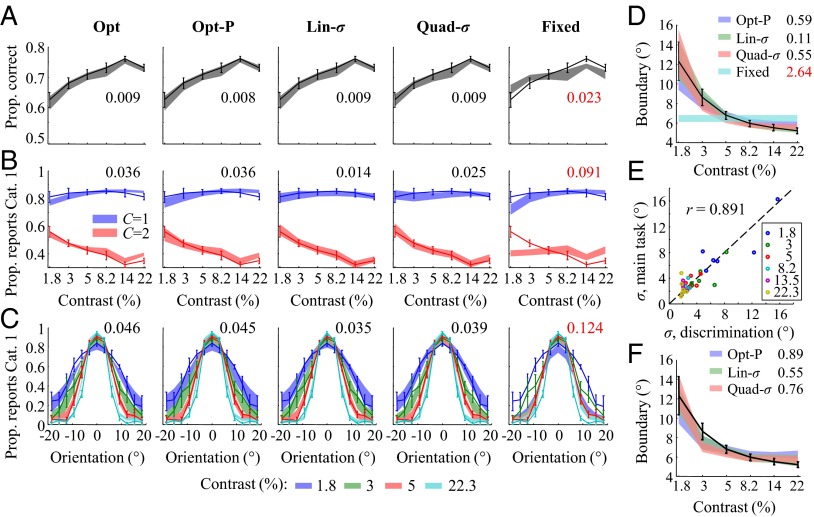
Fig. 2.
(A) Proportion correct versus contrast, with model fits. Model fits often do not look smooth because they were computed based on the orientations actually presented in the experiment, and those were drawn randomly (see SI Text). Here and elsewhere, error bars and shaded areas indicate 1 SEM, and numbers indicate root mean squared error between data and model means (red is worst). (B) Proportion “Category 1” responses versus contrast, separated by true category, with model fits. (C) Proportion “Category 1” responses versus orientation and contrast, with model fits. For visibility, not all contrasts are plotted. (D) Decision boundaries fitted separately at each contrast level (error bars: data; shaded areas: models). (E) Estimates of sensory uncertainty σ estimated from the categorization task against ones obtained from an independent orientation discrimination task; color labels contrast. (F) Decision boundaries predicted by three probabilistic models based on the uncertainty estimates from the discrimination task.

