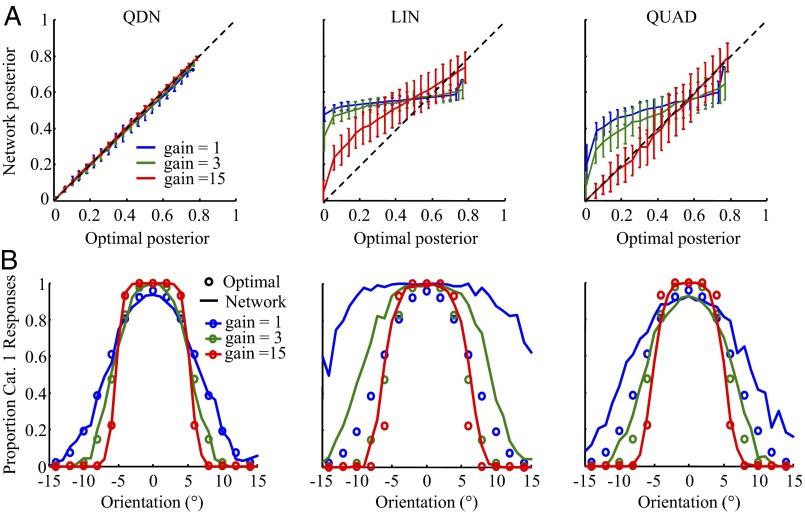
Fig. 5.
Network results. (A) The posterior probability of Category 1 as decoded from the network versus the optimal posterior (binned), at different levels of input gain (sensory uncertainty), for a QDN network (trained for 10,000 iterations), a linear network (trained for 100,000 iterations), and a quadratic network (trained for 100,000 iterations). Error bars are SDs. Network information loss was 0.39%, 41.7%, and 21.0%, respectively; we verified that these values were close to the asymptotic ones. Note that the optimal posterior is bounded from above (see SI Text). (B) Proportion of Category 1 responses as a function of orientation for the optimal observer (dots) and the three networks (lines). The QDN network is the only of the three networks that performs well at each level of sensory uncertainty.

