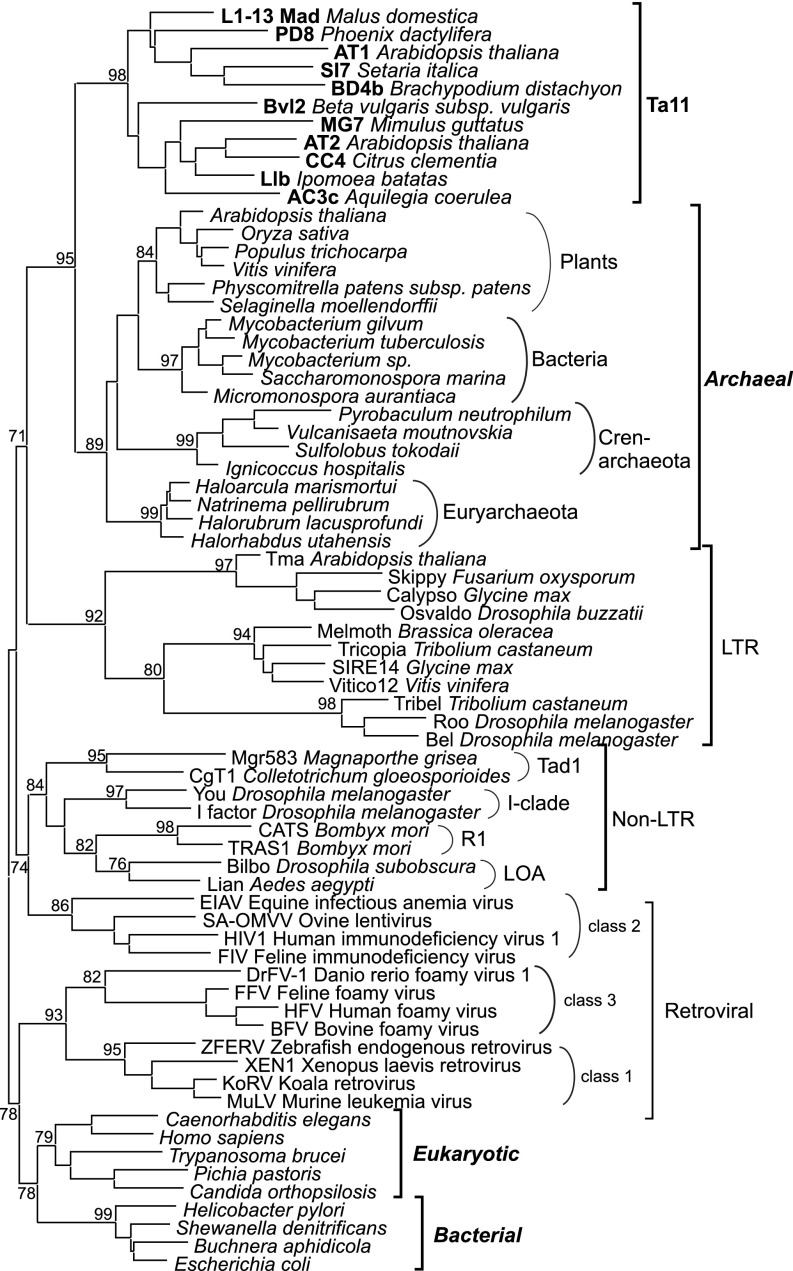
Fig. 3.
Maximum-likelihood tree based on the amino acid sequences of different types of RNHs. Statistical support was evaluated by the approximate likelihood-ratio test (aLRT). The different types of RNHs are denoted with brackets to the right of the tree. The names of Ta11 retrotransposons are in shown in bold font. The names of the three types of RNHs that are not associated with RT are shown in bold italic font. Accession numbers of the sequences are provided in Fig. S3.

