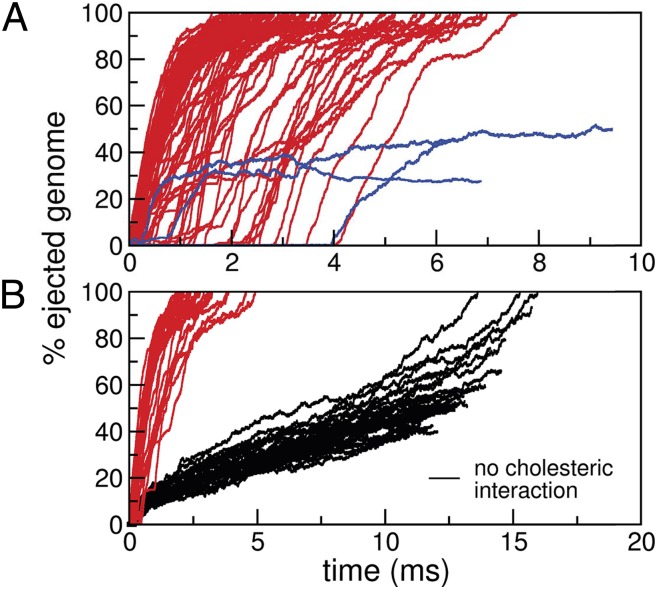
Fig. 1.
(A) Time evolution of the percentage of ejected DNA for  simulations where the DNA cholesteric self-interactions were accounted for. Red curves refer to runs where ejection proceeds to completion, whereas blue lines pertain to runs in which the DNA gets “stuck” and ejection halts midway. (B) Black curves refer to 30 simulations without the cholesteric interaction. The much slower ejection rate is manifest by comparison with the red curves which pertain to an equal number of runs with cholesteric interactions and lag time smaller than 0.5 ms.

