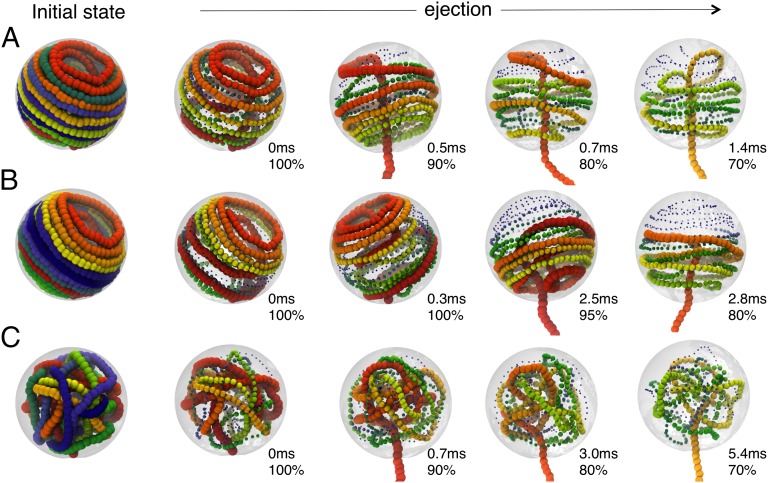
Fig. 2.
Snapshots from three ejection runs. The DNA cholesteric interactions were considered for runs shown in A and B (as well as for generating the initial fully packaged state). The two runs differ for the (A) absence and (B) presence of an initial lag phase. The cholesteric interaction was neglected in C. The initial arrangements of the packaged genome are shown (Left) and followed by snapshots taken at various time intervals and percentage of packaged genome, as indicated. For visual clarity, beads are colored with a rainbow scheme (red → yellow → green → blue), and their rendered size is decreased systematically going from the red to the blue end.

