
Fig. 3.
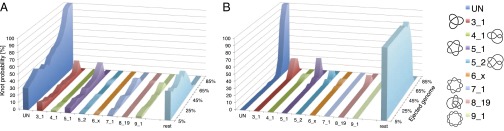
Percentage of occurrence of various types of physical knots as a function of the amount of ejected DNA when cholesteric interactions are (A) included or (B) omitted. Only runs which eventually fully eject their DNA are considered. For simplicity, knots are sketched with closed–curved diagrams [produced with the Knotplot software (www.knotplot.com) developed by R.G. Scharein] and are labeled with standard nomenclature with the proviso that UN refers to the unknot, and  includes the 61, 62, and 63 knots. Diagrams of torus and twist knots are shown on the left and on the right, respectively.