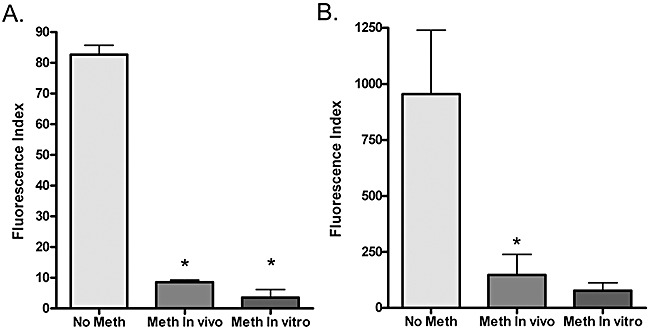
Figure 4.

Graph of the effect of DNA methylation on RSV promoter activity. HEK293T cells were transiently transfected with the plasmid pRSV‐GFP that was either non‐methylated (No Meth), methylated in vivo (Meth In vivo) or methylated by incubation with purified SssI methylase (Meth In vitro). Two different DNA concentrations were transfected including low dose, 400 ng (A), or high dose 2 µg (B). The graph shows data from three or more independent experiments ± SD. The fluorescence index was determined my multiplying the %GFP‐positive cells times the mean fluorescence intensity of those cells. The asterisk (*) indicates statistical significance (P < 0.05) by Student's t‐test comparing in vivo with no methylation and in vitro with in vivo methylated.
