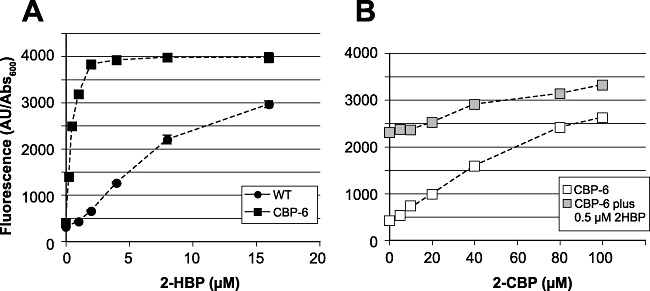
Figure 7.

Egfp fluorimetry analysis of E. coli‐expressing HbpR wild type or mutant CBP‐6, as a function of 2‐HBP or 2‐CBP concentration. Culture fluorescence expressed in arbitrary units (given by the machine) divided by the culture turbidity at 600 nm. A. Hypersensitivity response of mutant CBP‐6 compared with wild‐type HbpR. B. Calibration of mutant CBP‐6 to 2‐CBP without and with 0.5 µM 2‐HBP added (grey symbols). Note that error bars may be smaller than the symbol size.
