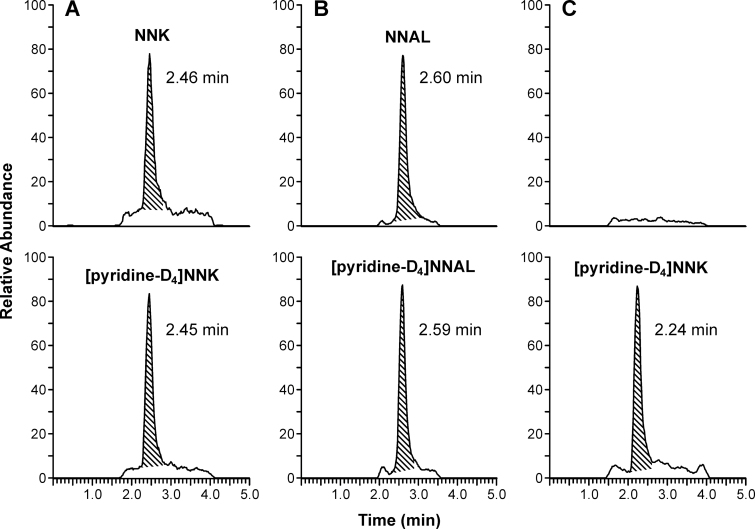
Figure 2.
Chromatograms obtained upon LC-MS/MS analysis of extracts of swabs for NNK and NNAL. (A) From a smokers’ home, monitored at m/z 208 → m/z 122 for NNK and m/z 212 → m/z 126 for [pyridine-D4]NNK; (B) from a smokers’ home, after treatment with NaBH3CN, monitored for m/z 210 → m/z 180 for NNAL and m/z 214 → m/z 184 for [pyridine-D4]NNAL; (C) from a nonsmokers’ home showing no peak for NNK.

