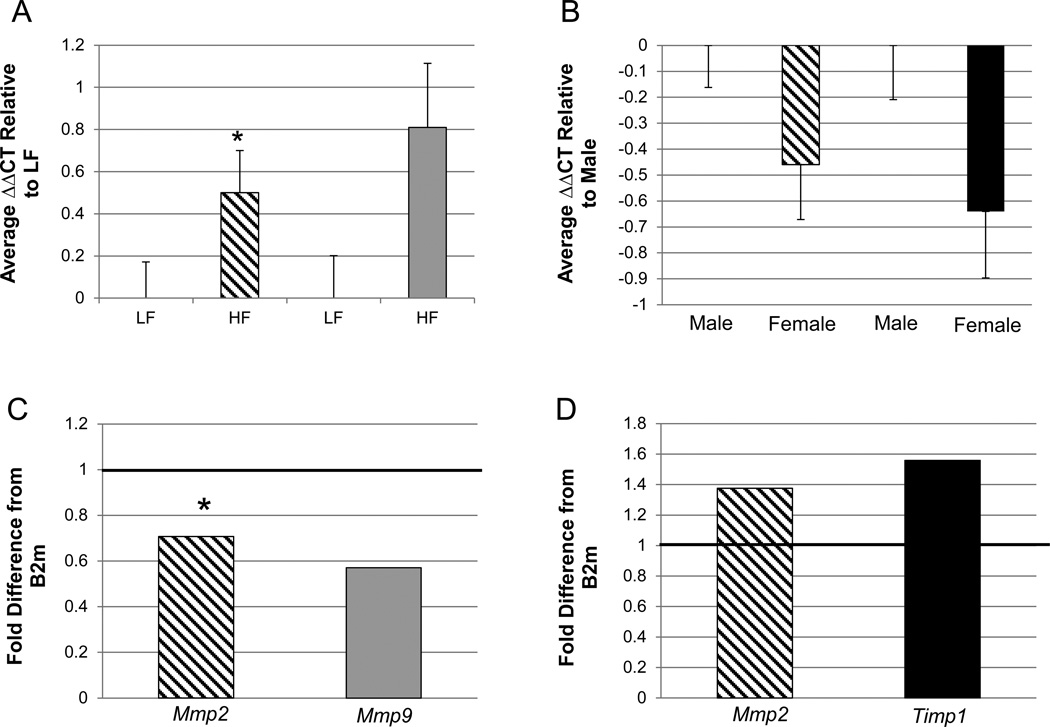
Figure 3. Quantitative RT-PCR assessment of the expression of genes potentially involved in inward remodeling in offspring thoracic aortas.
All gene expressions were normalized to the expression of B2m (ΔCT) and then averaged within the respective groups. A. The relative difference in cycle thresholds (ΔΔCT) between the HF and LF treatment groups for Mmp2 and Mmp9. B. The relative difference ΔΔCT between females and males for Mmp2 and Timp1. The error bars represent the S.E.M. The fold differences between treatments groups for each gene analyzed were then calculated. C = fold difference calculation of data presented in A. D = fold difference calculation of data presented in B. The solid black line across “1” demarcates “LF” for the two bars in C (diet effect) and “males” in D (sex effect). Mmp2 = diagonal line bar; Mmp9 = gray bar; Timp1 = black bar. MMp2 - HF vs. LF, females vs. males; n=24 and 29, n=24 and 29, respectively. Mmp9 - HF vs. LF n=24 and 29, respectively. Timp1 - females vs. males; n=24 and 29, respectively. All differences are significant at p<0.05, except for the asterisk (*) which represents a trend at p<0.1. LF=consumption of maintenance chow by mothers and offspring. HF=maternal and offspring consumption of a diet with 24% fat and 17.5% high fructose corn syrup. ΔCT = change in cycle threshold. B2m= beta 2-microglobulin.

