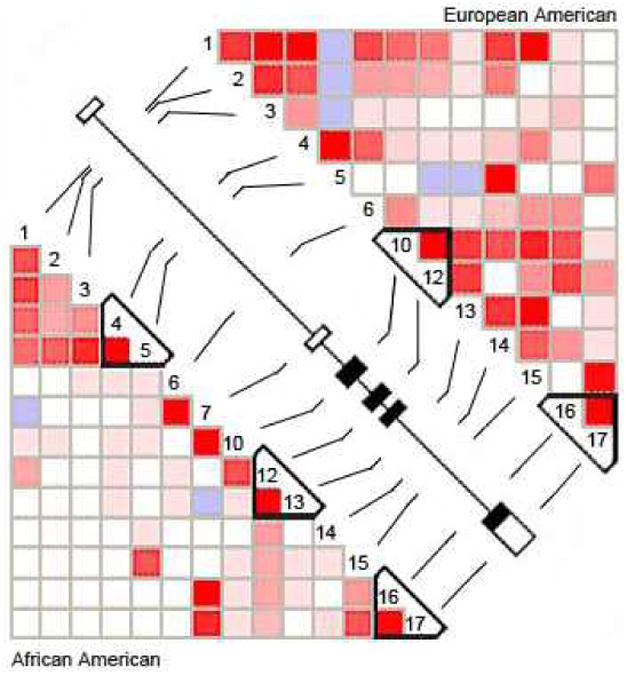
Figure 1.

Pairwise LD of COMT gene in African-American (AA) and European-American (EA) families. AAs showed three short blocks and EAs showed two short blocks. Numbers 1 to 17 represent SNPs correlating with rs number in Table II across COMT gene. All COMT exons (the dark box represents coding region and the clear box represent the noncoding region; 3′ and 5′ UTR) shown in the center of picture include the position of the 17 SNPs genotyped in this study. From haploview, the bright red box represents D′ = 1 and LOD = 2, shades of pink/red represent D′ < 1 and LOD = 2, blue represents D′ = 1 and LOD < 2, and white represents D′ < 1 and LOD < 2.
