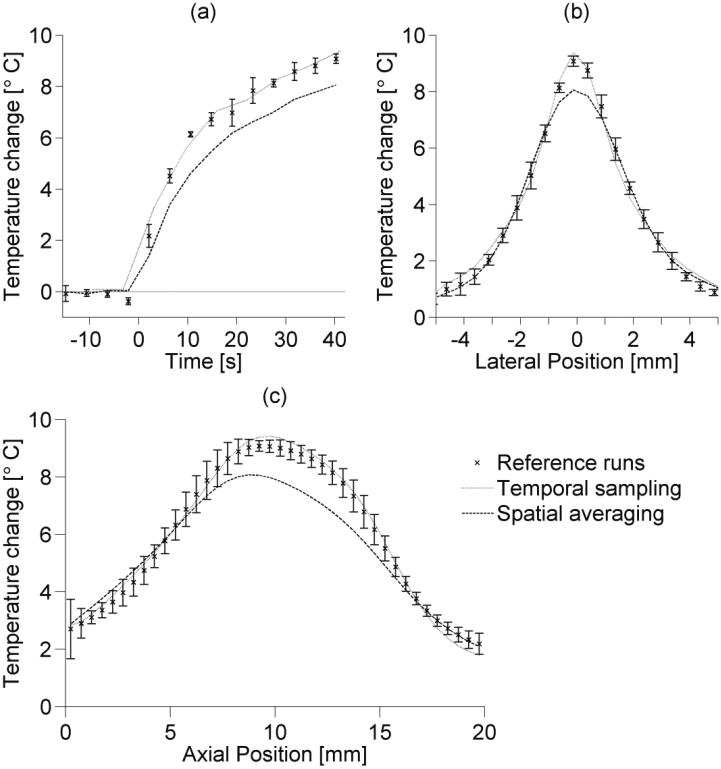
Figure 7.
Experimental temperatures for reference runs (1×1×3 mm3 spatial resolution, tacq=4.2 s), temporal sampling data (1×1×3 mm3 spatial resolution, tacq=6.3 s), and spatial averaging data (2×2×3 mm3 spatial resolution, tacq=4.2 s) in ex vivo pork loin. (a) is a temperature-versus-time curve at the location of maximum heating, while (b) and (c) are respectively lateral and axial temperature profiles from the last measurements of the ultrasound heating. Error bars (N=4) extend to ±1 standard deviation of the reference temperature data. Lateral positions are measured from the beam axis and axial positions are measured from the imaging plane nearest the transducer.

