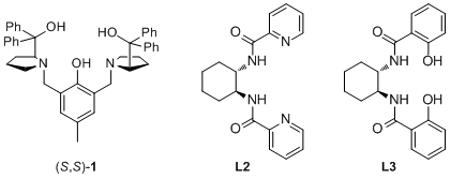
Table 1.
Initial Optimization.[a]

| R | conc.[b] | temp. | time | X | yield | ee[c] | |
|---|---|---|---|---|---|---|---|
|
| |||||||
| Ligand Screening | |||||||
|
| |||||||
| 1 | Ph | 0.18 | rt | 22 h | 20 (1) | 78% | 80% |
| 2 | Ph | 0.18 | 0 °C | 16 h | 20 (L2) | 26% | 35% |
| 3 | Ph | 0.18 | 0 °C | 16 h | 20 (L3) | 36% | −66% |
|
| |||||||
| Time, Temperature and Catalyst Loading, X = (S,S)-1 | |||||||
|
| |||||||
| 4 | Ph | 0.18 | rt | 72 h | 20 | 95% | 79% |
| 5 | Ph | 0.18 | rt | 48 h | 10 | 77% | 83% |
| 6 | Ph | 0.18 | −20 °C | 45 h | 10 | 60% | 77% |
| 7 | Ph | 0.18 | −20 °C | 45 h | 5 | 32% | 72% |
|
| |||||||
| Reaction Concentration, X = (S,S)-1 | |||||||
|
| |||||||
| 8 | TMS | 0.18 | 3 °C | 21 h | 10 | 35% | 85% |
| 9 | TMS | 0.26 | 3 °C | 21 h | 10 | 50% | 85% |
| 10 | TMS | 0.38 | 3 °C | 24 h | 10 | 74% | 85% |
| 11 | TMS | 0.69 | 3 °C | 21 h | 10 | 87% | 75% |
|
| |||||||
| Catalyst Loading at Higher Concentration, X = (S,S)-1 | |||||||
|
| |||||||
| 12 | Ph | 0.38 | 3 °C | 24 h | 10 | 86% | 74% |
| 13 | Ph | 0.38 | 3 °C | 24 h | 5 | 73% | 58% |
| 14 | Ph | 0.38 | 3 °C | 21 h | 2.5 | 68% | 46% |

Reactions run on a 0.325 mmol scale with 2.7 or 2.8 equiv alkyne and 2.6 or 2.95 equivalents of dimethylzinc respectively. Isolated yields are reported.
Reaction concentration (in molarity) is reported with respect to the alkyne and includes the toluene added as part of the dimethylzinc solution.
Enantiomeric excess determined by chiral HPLC analysis.
