
Figure 1. ID3 limited the number of PLZF+ and Tet+ cells among PS DP thymocytes.
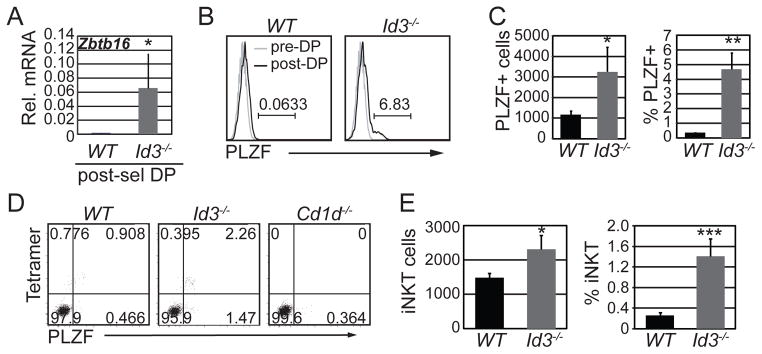
(A) Quantitative RT-PCR (qPCR) analysis for Zbtb16 (PLZF) mRNA in sorted WT and Id3−/− TCRγδ-CD4+CD8+TCRβ+CD69+ thymocytes. The y-axis indicates Zbtb16 mRNA relative to Hprt mRNA analyzed in the same samples. Graphs show the mean ± SD of 5 independent experiments. n=5, *p<0.05, two-tailed unpaired t test. (B) Histograms showing expression of PLZF in gated TCRγδ-CD4+CD8+TCRβ+CD69+ (black line, post-DP) or TCRγδ-CD4+CD8+TCRβ−CD69− cells (grey line, pre-DP) thymocytes from the indicated mouse strains. The number above the line shows percent of PLZF+ cells among PS DP cells. (C) Average number and percentage of of PLZF+ among TCRγδ-CD4+CD8+TCRβ+CD69+ thymocytes. Graphs show mean ± SD of 8 independent experiments. n=8, *p<0.05, **p<0.01, ***p<0.001. (D) Flow cytometry plots showing PLZF and Tet staining on TCRγδ-CD4+CD8+TCRβ+CD69+ thymocytes from mice of the indicated genotype. (E) Graphs show the average number and percentage of Tet+ PS DP cells among PS DP thymocytes in WT and Id3−/− mice. Graphs show mean ± SD of 10 independent experiments. n=10, *p<0.05, ***p<0.001, two-tailed paired t test.