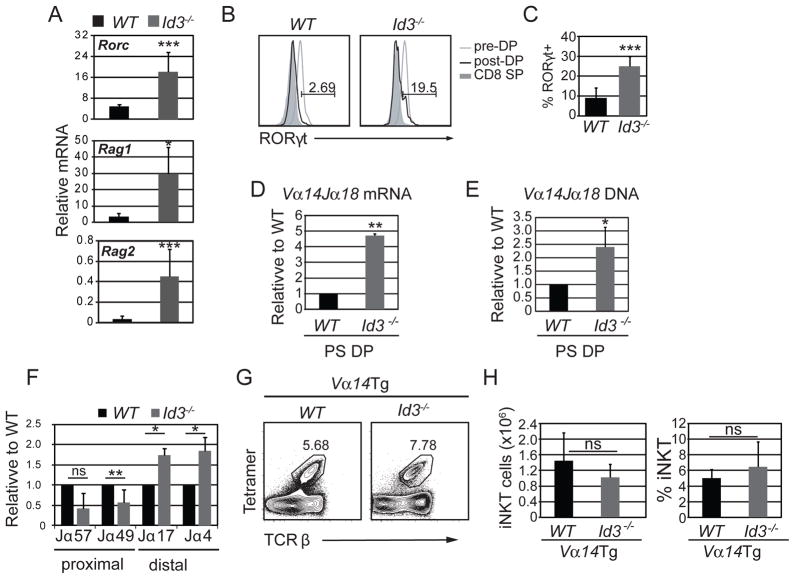
Figure 2. Id3−/− PS DP thymocytes had an increased number of Vα14Jα18 recombination events.
(A) qPCR analysis of Rorc, Rag1 and Rag2 mRNA in sorted CD4+CD8+TCRβ+CD69+ thymocytes from WT and Id3−/− mice. Graphs show mean ± SD of 5 independent experiments. n=5, *p<0.05, two-tailed unpaired t test. (B) RORγt in gated post-selection (black line) or preselection (grey line) DP thymocytes from WT and Id3−/− mice. The shaded histogram shows RORγt expression in CD8+TCRβ+ cells, as a negative control. The number above the line shows percent of RORγt+ cells among PS DP cells. (C) Graph shows the average percentage of RORγt+ cells among PS DP cells in WT and Id3−/− mice. n=8, ***p<0.001. qPCR analysis of (D) Vα14Jα18 mRNA and (E) Vα14Jα18 DNA rearrangements in sorted CD4+CD8+TCRβ+CD69+ thymocytes from WT and Id3−/− mice. Numbers change in detection relative to WT. Graphs show the mean ± SD from 5 independent experiments. n=5 *p<0.05, **p<0.01, two-tailed unpaired t test. (F) qPCR analysis of Jα transcripts containing Jα gene segments that are proximal and distal to Vα in TCRγδ-CD4+CD8+TCRβ+CD69+ thymocytes cells sorted from WT and Id3−/− mice. Numbers show change in detection relative to WT for each Jα transcript. Graphs show the mean ± SD from 3 independent experiments. n=3 *p<0.05, **p<0.01, two-tailed unpaired t test. (G) Flow cytometry plots of total thymocytes from Id3+/+;Vα14Tg and Id3−/−;Vα14Tg mice showing the percentage of Tet+TCRβ+ iNKT cells. (H) Average number and percentage of iNKT cells in the indicated mouse strains. Graphs show the mean ± SD from 10 independent experiments, n=10.

