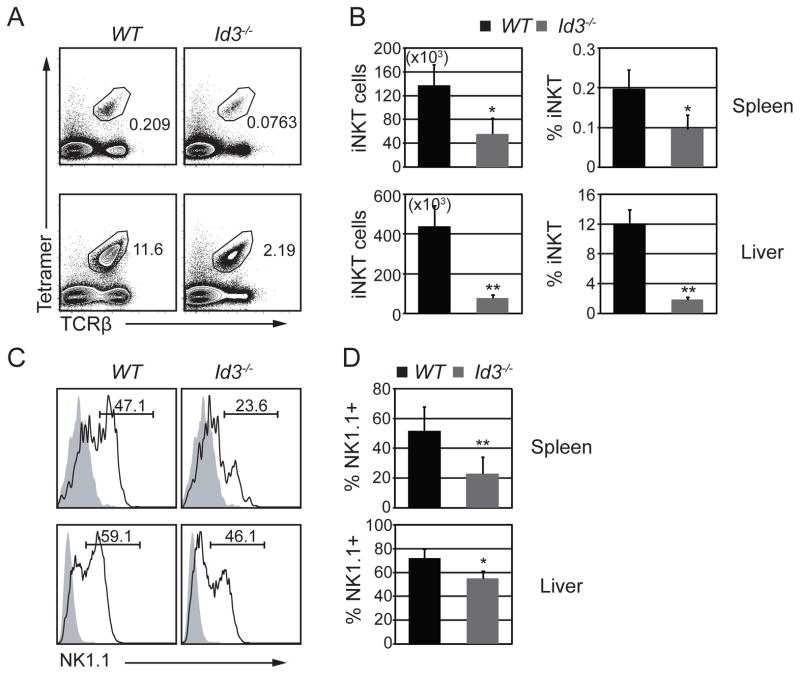
Figure 5. Id3−/− peripheral iNKT cells failed to mature.
(A) Flow cytometry plots showing the percentage of Tet+TCRβ+ iNKT cells in the spleen and liver from WT and Id3−/− mice. (B) Graphs show average number and percentage of iNKT cells in the spleen and liver of the indicated mouse strains. Graphs show mean ± SD from 8–10 independent experiments. *p<0.05, **p<0.01. (C) Histograms showing the expression of NK1.1 on total iNKT cells in the spleen and liver of WT and Id3−/− mice. Shaded histogram is the isotype control. Numbers indicate percent of NK1.1+ cells among iNKT cells. (D) Graphs show average percentage of NK1.1+ cells among the iNKT population in the spleen and liver of the indicated mouse strains. Graphs show mean ± SD from 8–10 independent experiments. *p<0.05, **p<0.01.

