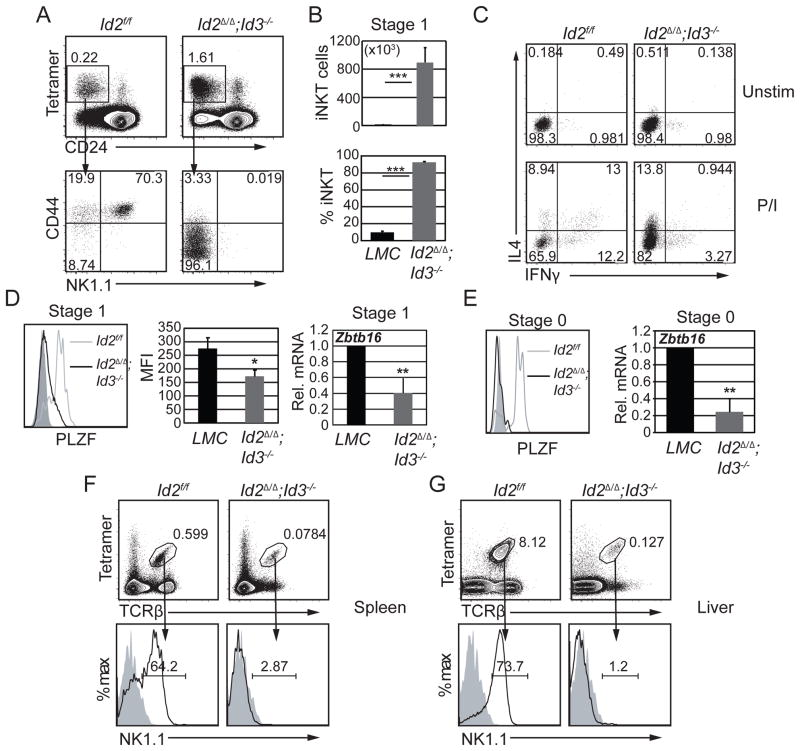
Figure 8. Id2 and Id3 regulate iNKT cell specification.
(A) Id2f/f and Id2Δ/Δ;Id3−/− thymocytes were analyzed for Tet+CD24− iNKT cells (upper panel). The percentage of Tet+CD24− cells is indicated. CD44 and NK1.1 expression is shown in gated Tet+CD24− iNKT cells (lower panel). Numbers indicate percent of cells in the respective quadrants. (B) Average cell number and percentage of stage 1 iNKT cells in the indicated mouse strains. Graphs show the mean ± SD of 8 independent experiments. n=8, ***p<0.001. (C) Total thymocytes from Id2f/f and Id2Δ/Δ;Id3−/− mice were cultured in vitro with (lower panel) or without (upper panel) PMA and ionomycin for 5 hours. Intracellular staining of IFNγ and IL4 in gated Tet+CD24− cells is shown. Numbers indicate percent of cells in each quadrant. (D) Histogram (left panel) showing PLZF expression in stage 1 iNKT cells from Id2f/f (grey line) and Id2Δ/Δ;Id3−/− (black line) mice. Solid grey indicates PLZF expression from conventional CD4 thymocytes from littermate control mice. Graph (middle panel) shows the average mean fluorescence intensity (MFI) from 10 independent experiments. n=12, *p<0.05. Graph (right panel) shows qPCR analysis of Zbtb16 mRNA in sorted stage 1 (Tet+CD24−CD44−NK1.1−,) iNKT thymocytes from LMC and Id2Δ/Δ;Id3−/− mice. Numbers in the y-axis indicate fold change relative to LMC stage 1 expression. Graphs show the mean ± SD from 3 independent experiments. n=3, **p<0.01, two-tailed unpaired t test. (E) Histogram (left panel) showing PLZF expression in stage 0 (Tet+CD24+CD69+CD44−) iNKT cells from Id2f/f (grey line) and Id2Δ/Δ;Id3−/− (black line) mice. Solid grey indicates PLZF expression from conventional CD4 thymocytes from littermate control mice. Histogram is representative of two independent experiments. Graph (right panel) shows qPCR analysis of Zbtb16 mRNA in sorted stage 0 (Tet+CD24+CD69+CD44−) iNKT thymocytes from LMC and Id2Δ/Δ;Id3−/− mice. Numbers in the y-axis indicate fold change relative to LMC stage 1 expression. Graphs show the mean ± SD from 3 independent experiments. n=3, **p<0.01, two-tailed unpaired t test. Flow cytometry plots showing lymphocytes from the (F) spleen and (G) liver of the indicated mouse strains analyzed for Tet+TCRβ+ cells (upper panel). The percent of Tet+TCRβ+ cells is indicated. Histograms showing the percent of NK1.1+ iNKTs (lower panel). Solid grey indicates the isotype control.

