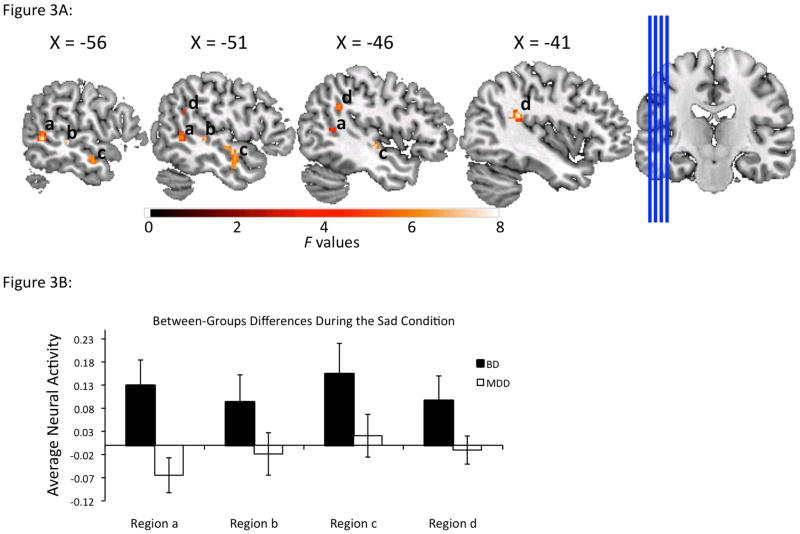
Fig. 3.
Panel A displays areas demonstrating significant group [depressed bipolar disorder (BD), depressed major depressive disorder (MDD)]-by-emotion (anger, fear, sad, happy) interactions in left temporoparietal regions in which individuals with BD displayed greater activity than individuals with MDD to sad faces. Plotted values represent F-statistics. Panel B displays bar graphs representing average activity for the sad condition, extracted from the clusters presented in Panel A. Peak values (Montreal Neurologic Institute) from each of the regions are as follows: Region a: x = −58, y = −52, z = 2; Region b: x = −56, y = −30, z = 0; Region c: x = −46, y = −16, z = −4; Region d: x = −40, y = −40, z=22. Error bars represent +/−1 standard error.

