Fig. 6.
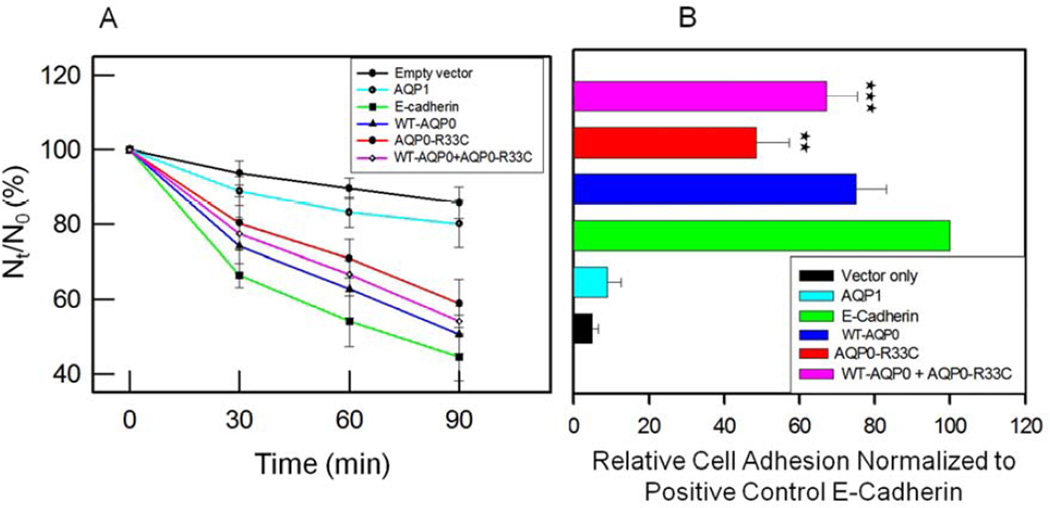
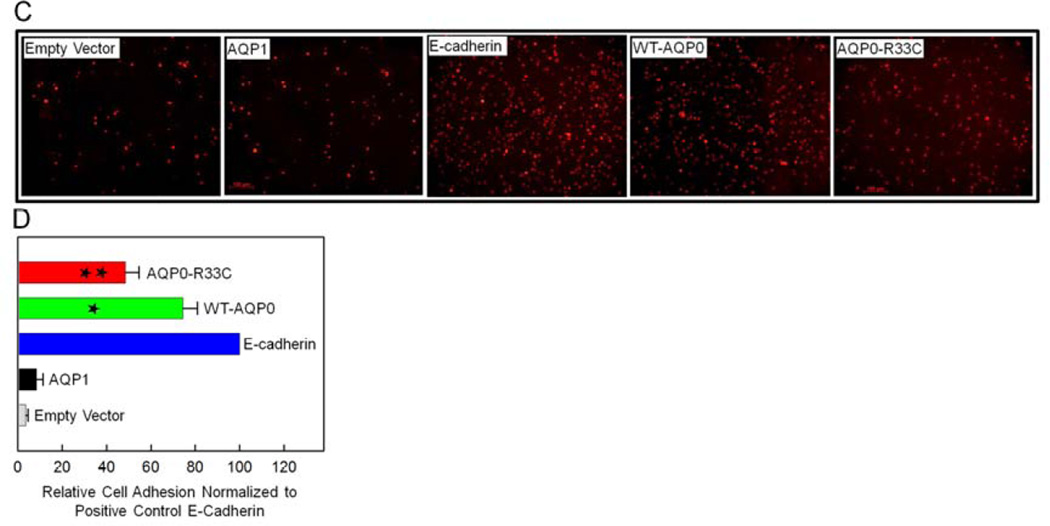
Cell aggregation assay using rotary gyratory shaker. (A). Cell aggregation exhibited by adhesion-deficient L-cells expressing empty vector, AQP1, E-cadherin, WT-AQP0, AQP0-R33C or WT-AQP0 + AQP0-R33C in relation to incubation time. (Nt -total number of particles at time ‘t’ of incubation; N0 - initial number of particles). (B). Cell-to-cell adhesion assay using a microplate reader. Over a monolayer of L-cells expressing empty vector (negative, control), AQP1 (negative, control), E-cadherin (positive control), WT-AQP0, AQP0-R33C or WT-AQP0 + AQP0-R33C corresponding cells loaded with CellTracker Red were plated. A microplate reader was used to obtain data as described in the ‘Materials and Methods’ section. Stars (**, ***) indicate statistically significant reduction in cell-to-cell adhesion in AQP0-R33C or WT-AQP0 + AQP0-R33C compared to the WT-AQP0. (C). Cell-to-cell adhesion assay using a fluorescence microscope. Over a monolayer of L-cells expressing empty vector, AQP1, E-cadherin, WT-AQP0 or AQP0-R33C corresponding cells loaded with CellTracker Red were plated. At the end of the procedure described in the ‘Materials and Methods’ section, cells were imaged under an epifluorescent microscope (Zeiss). Cells/aggregates were counted and values were plotted. (D). Histogram showing the extent of cell-to-cell adhesion exhibited after 45 min. of incubation by samples tested using the fluorescence assay. *Compared to E-Cadherin, WT-AQP0 exhibited significantly low (P< 0.001) cell-to-cell adhesion. **Compared to WT-AQP0, mutant AQP0-R33C exhibited significantly low cell-to-cell adhesion.


