Figure 1.

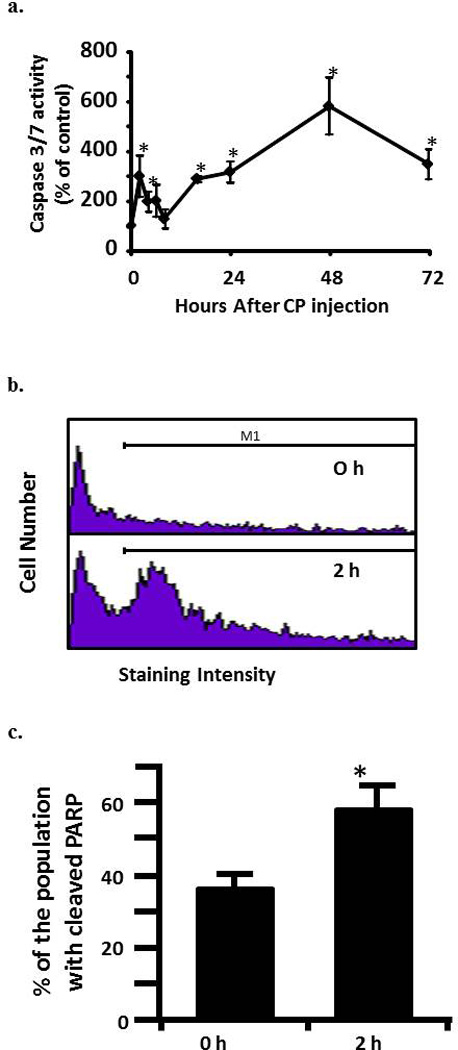
a. Activity of caspase-3/7 in rat urothelium over time following injection of 80 mg/kg CP. Data points are the mean ±SEM. Asterisks indicate values significantly different from 0 h (p<0.0006 at 2h, <0.02 at 4 h, <0.0015 at 16 h, <0.014 at 24 h, <0.0001 at 48 h and < 0.007 at 72h). n = 3-6 replicates. b. Flow cytometry histograms showing the cell population staining positive (under the M1 gate) for cleaved PARP in rat urothelium 0 and 2 h following 80 mg/kg CP. c. Quantitative analysis of b. Data points are the mean ± SEM. Asterisks indicate significant differences from 0 h control. n = 5; p<0.05.
