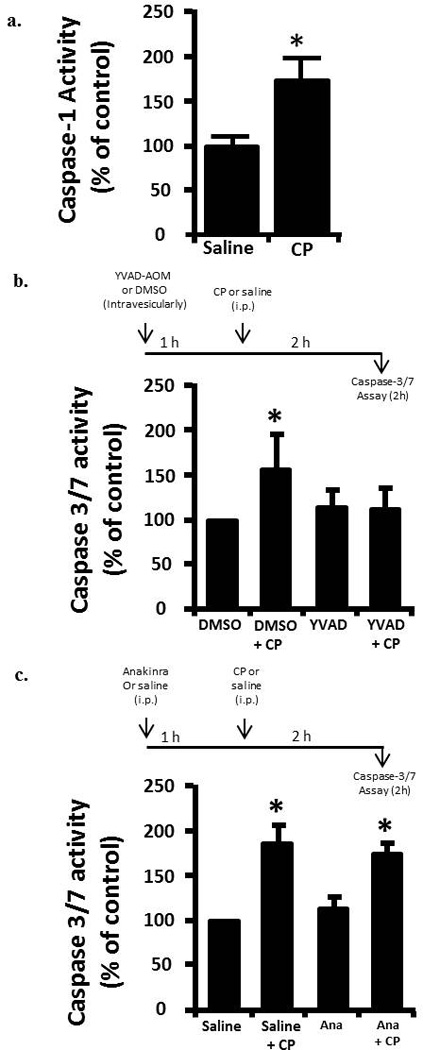
Figure 3.

a. Caspase-1 activity in rat urothelium 2 h after injection of 80 mg/kg CP or saline control. Data points are the mean ± SEM. Asterisks indicate values significantly different from the mean value at 0 h, n = 6, p<0.05. b. (upper) diagram of the protocol for treatment with YVAD-AOM , CP and DMSO. b. (lower) caspase-3/7 activity in the various treatment groups. Data points are the mean ± SEM. Asterisks indicate values significantly different from DMSO control; n=6, p<0.05. No other differences between groups were significant. c. (upper) diagram of the protocol for treatment with Anakinra (Ana), CP and saline. c. (lower) caspase-3/7 activity in the various treatment groups. Data points are the mean ± SEM. Asterisks indicate values significantly different from saline control; n=5-6, p<0.05. No other differences between groups were significant.
